Macro DIC
| Champion | Wayne Heatman, Elliot Cooksey-Nash |
|---|---|
| Analysis codes | - |
| Tutorials | - |
| Metadata templates | - |
This document oulines the procedure for carrying out macro DIC measurements. This procedure should be followed for achieving best quality data and make it ready for sharing and re-use.
Application of speckle pattern
- Spray the white paint down first, spray from far away to deposit a fine mist
- Keep spraying until the shiny metal surface has been completely covered
- Then spray with black paint until it is covering 30-40% of the surface
- You want the layer of paint to be as thin as possible to stop flaking during deformation
- Once you have finished spray painting turn the cans upside down and spray them until only gas is being realised, this stops the cans from clogging.
Image aquisistion setup
The images that are to be obtained need to be as sharp as possible. Therefore, when firstly setting up a camera prior to testing there are a number of considerations that need to be taken into account:
- good, bright lighting is essential, and the LED lights included on the DIC equipment should be used.
- use a dark background behind the sample (e.g. use non-reflective gaffer tape)
- The aperture needs to as high and (as closed as possible) - this gives shaper image and increased depth of focus.
- Speckles should be 3-4 pixels in size and well focused before starting the test.
- Working distance should be as small as possible and must be recorded
Testing
- take up to 10 images of the sample before starting the test
- in most cases, chose an aquisition rate to give 300-1000 images per test
- check exposure time is at least 100 ms
DIC calculation
- correlation mode needs to be set to ‘Relative to first’
- calculation mode should be ste set to ‘Accurate’.
Data export for analysis
- Export data using ASCII test. Make sure the decimal seprator is set to (‘.’).
- export images in a lossless format (TIF)
- analysis should be carried out using Python scripts, which will be shared on GitHub. Links to appear here.
Error determination and calibration
This section explains how the subset size and step size affect noise/error in DIC (Digital Image Correlation) data. This section should help you to decide what subset size and step size you should choose for analysing your DIC data. The analysis was done using the DIC python code for the .csv output format from the LaVision DaVis DIC software.
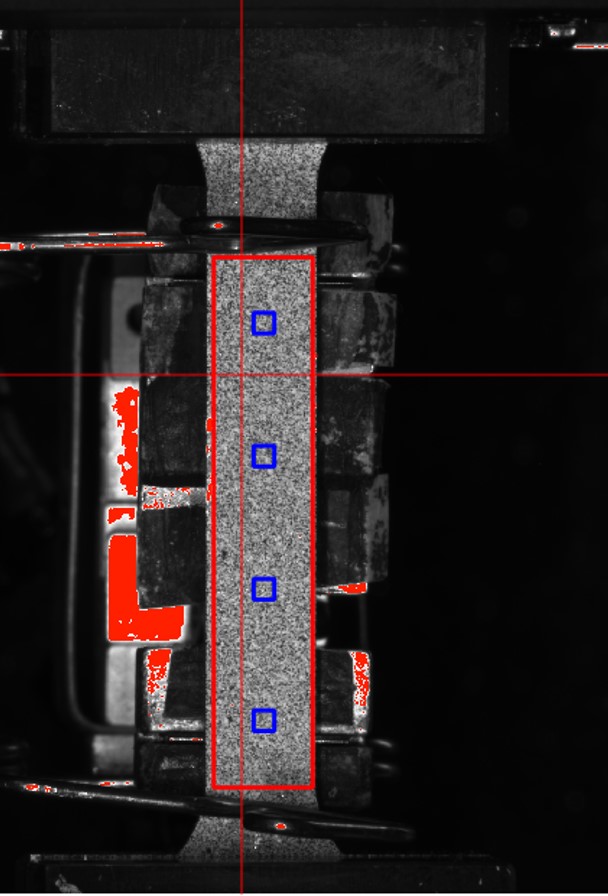
The following analysis was carried out on the first 10 images of one set of DIC data. The subset size and step size where changed and the strain was recorded. The images were captured before any deformation had begun, so there should be no strain detected. Any strain detected by the DIC software is therefore noise in the recording. The area in which the data was gathered from can be seen in the image below.

Example Error determination and calibration
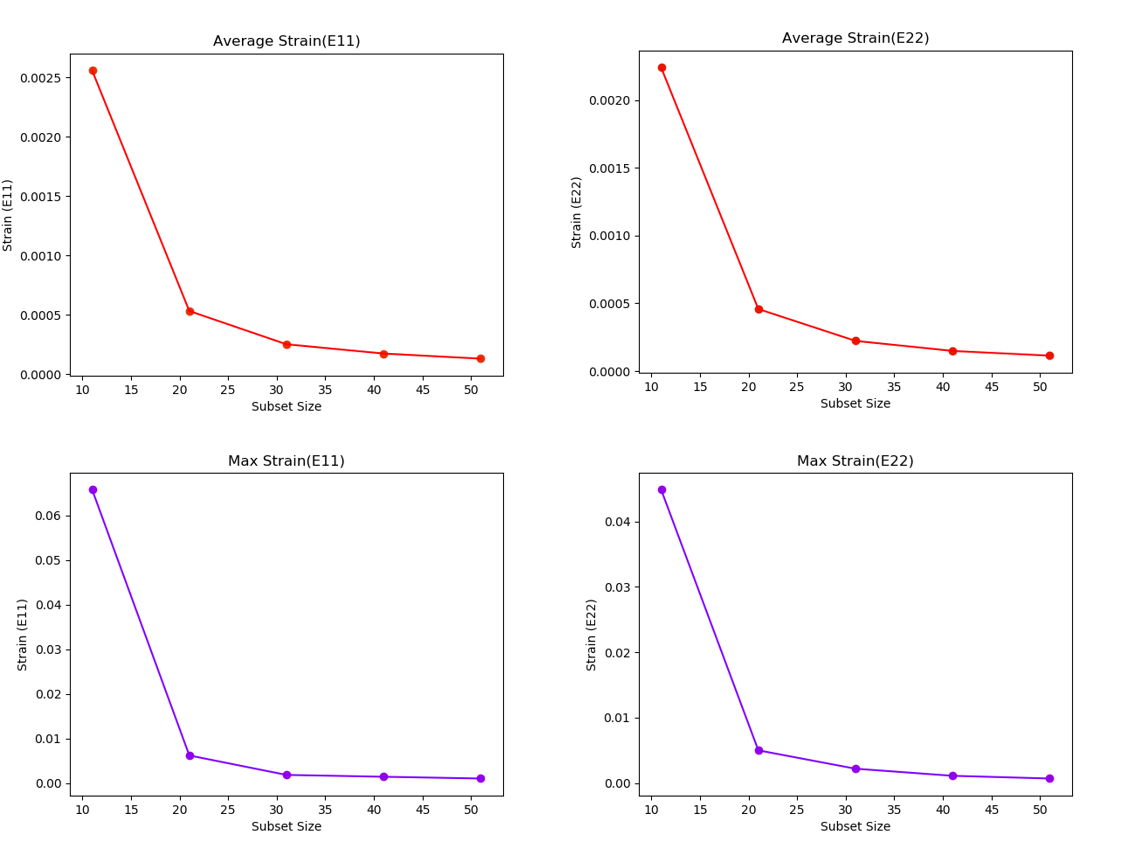
The first set of tests were performed to look at the variation in strain with changing Subset Size and constant step size. The Subset size variation can be seen below:
- Subset size 11, step size 3
- Subset size 21, step size 7
- Subset size 31, step size 10
- Subset size 41, step size 13
- Subset size 51, step size 17
The subset size to step size ratio was kept the same (roughly 3:1). The graphs below show the variation in strain with subset size in the principle strain directions 11 (Parallel to elongation) and 22 (Perpendicular to elongation). Both the average strain and max strain recorded over the 10 images are displayed in the images below. The larger the subset size the lower the error, however you will lose resolution in your strain maps as a result.

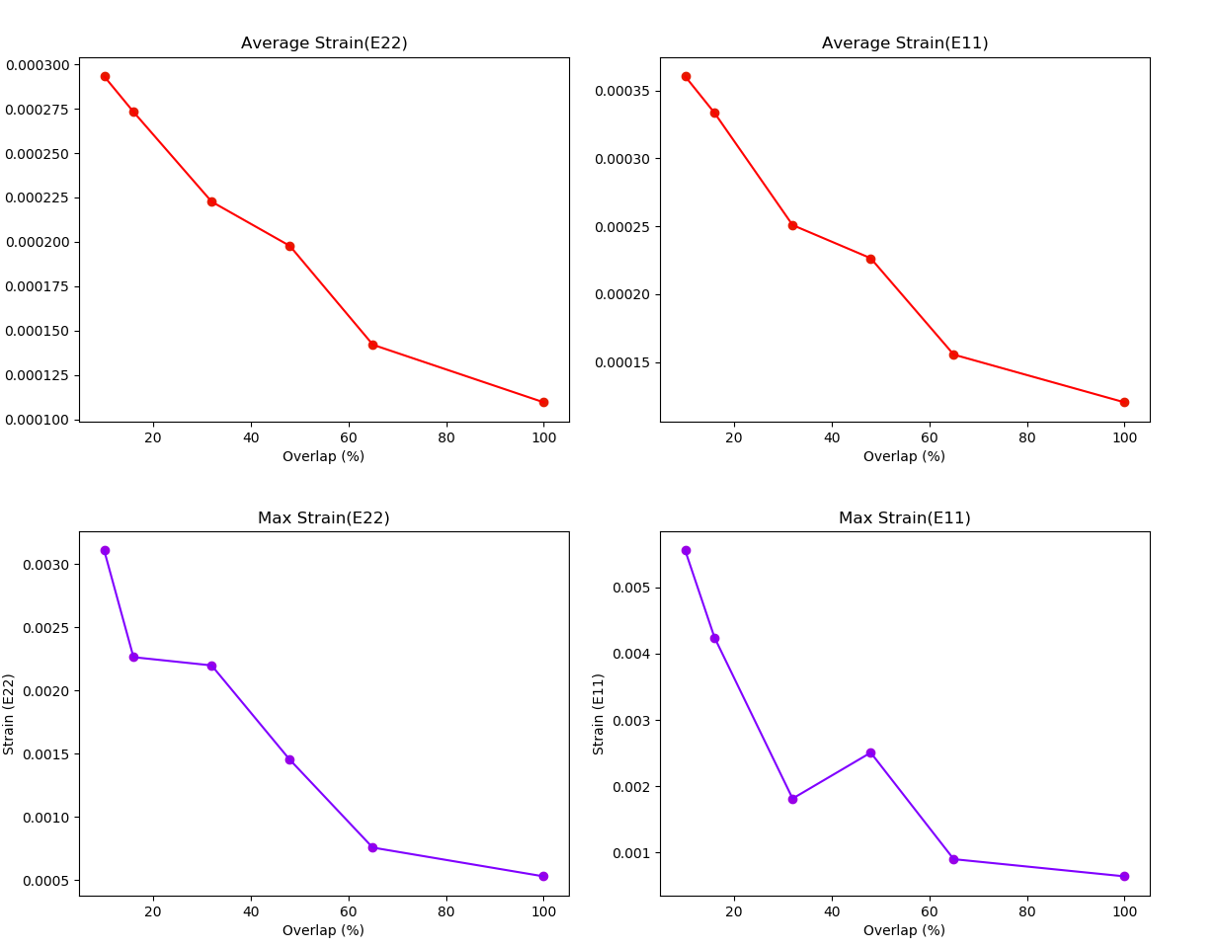
The next set of tests looked at the variation in strain with changing step size and constant subset size (31). The step size variation can be seen below:
- Subset size 31, step size 3, Overlap: 10%
- Subset size 31, step size 5, Overlap: 16%
- Subset size 31, step size 10, Overlap: 32%
- Subset size 31, step size 15, Overlap: 48%
- Subset size 31, step size 20, Overlap: 65%
- Subset size 31, step size 31, Overlap: 100%
From the figures below we can see that with increasing overlap there is a reduction in error, however the larger the overlap the longer the it takes to process the data.

The python script used to determine the strain values (experimental noise) is contained within the DIC python code for the .csv file format. When performing DIC experiments you should take at least 10 still images at the start of your experiment, then when you run your data through the python code you can compare the noise you are detecting against the results in this example.
