Dilatometer quenching tests
| Champion | Ed Pickering, Josh Collins, Mark Taylor |
|---|---|
| Analysis codes | |
| Tutorials | - |
| Metadata templates | - |
Executive Summary
What is this technique?
Quenching dilatometry is a technique that measures of the expansion or contraction of a sample (i.e., its dilatation) when its temperature is changed. A small specimen of material is placed into the dilatometer and is heat treated according to an inputted programme. The temperature is controlled very accurately, typically using induction to heat the sample and pressurised inert gas to cool it. Concurrently, the change in length of the sample is measured. This is typically recorded in one direction only, using pushrods. The change in length not only provides information regarding thermal expansion, but also solid-state phase transformations that involve significant changes in volume (e.g., the austenite to ferrite transition).
What information does it provide?
The principal output of an experiment is a graph of change in length vs. temperature. From this, the following can be extracted using appropriate data analyses:
- Transformation start and finish temperatures (e.g., martensite start). This can be used to create continuous cooling transformation (CCT) diagrams, continuous heating transformation (CHT) diagrams, and time-temperature-transformation (TTT) diagrams.
- The evolution of the volume fractions of microstructural constituents (e.g., martensite) with temperature.
- Thermal expansion coefficients.
Why/when use this technique?
The technique is very useful when attempting to characterise and predict the microstructures that form in steels during industrial heat treatment processes, in particular austenitisation + quenching. Different cooling rates can be experienced in different areas of large components when quenching, which may lead to the formation of different microstructures. Dilatometry allows for the heat treatments at specific locations or (e.g., at different thicknesses) to be simulated, and hence the microstructures to be characterised and predicted more readily. The construction of CCT and TTT diagrams is a particularly useful output in this regard.
What are the sample requirements?
Samples need to be cylinders measuring 4 mm in diameter and 10 mm in length. They may be made hollow for very fast heating and cooling rates. The flat ends of the cylinder should be as parallel as possible and ground or milled to a fine finish. The surface of the sample should be free from oxide.
How do we assess the data quality?
To assess the origins of artefacts that may be apparent within datasets, a number of approaches can be used:
- Different sample geometries and multiple thermocouple placements can be used to test whether non-uniform temperatures (or other geometry-related effects) are the cause of a phenomenon or not.
- Alternative sample materials, such as platinum, are also useful when looking for the cause of artefacts.
- Machine-derived artefacts can be assessed by examining the metadata gathered from results files, such as the data associated with HF power.
- Repeat measurements, either on the same sample or on samples of the same material, are always useful to determine whether artefacts have originated from one-time sample or machine oddities.
In addition, to ensure good data quality and that our interpretations are sound in general, the following may be used:
- Repeat measurements on different samples of the same material.
- Comparisons of results to those obtained through other experimental methods, in particular optical and scanning electron microscopy (SEM), and hardness.
- Comparisons to empirical relationships for start temperatures can provide reassurances with respect to the identity of a transformation start temperature.
- Comparisons to results from more advanced models for phase transformation kinetics can also be a useful way validate the interpretation of transformation curves.
What are the common limitations/pitfalls?
- Only phase transformations that involve significant changes in sample length can be measured using dilatometry. Hence, it is useful for steels that display solid-state allotropic phase transitions on heating/cooling, but is less useful for examining precipitation in nickel alloys or aluminium alloys.
- Sample sizes are typically no more than 4 mm diameter x 10 mm long. The technique measures the length change of the entire specimen only (it samples the whole volume at once).
- Heating and cooling rates of up to 100˚C s-1 are usually achievable in a well-controlled manner in most alloys. Heating and cooling rates of 1000˚C s-1 are achievable, but samples usually need to be hollow, the material has to have high thermal conductivity, and rates may not be so controllable.
- Typical maximum temperature of 1600˚C, although measurements and/or control of temperature may be less reliable at very high temperatures.
- It is difficult to assess volume fractions and start temperatures in mixed microstructures where there is overlap of transformations (e.g., bainite into martensite).
- It is also difficult to calculate accurate volume fractions if there is a significant amount of retained austenite (with unknown volume fraction) at the end of the test, or under certain circumstances in which there is a significant amount of carbon ioning to the austenite during transformation(s), since the procedure does not account for these occurrences.
• The orientation of the samples should be considered where transformations may be non-isotropic in terms of their strain, for example when a sample is textured and the transformation has a strain that varies with crystallographic direction.
1. Introduction
Dilatometry is the measurement of the expansion or contraction of a sample (i.e., its dilatation) when its temperature is changed. This typically involves measurement in one direction (e.g., change in sample length), but measurements can also be multi-dimensional.
The most common reason for conducting dilatometry measurements is to measure the thermal expansion coefficients a material. However, for steels and other metals that display allotropic transformations (i.e., a change in crystal structure with temperature), dilatometry can be used to examine their phase transformation behaviour. In steels, the change from body-centred cubic (BCC) ferrite to face-centred cubic (FCC) austenite (and the reverse) is accompanied by a change in volume of a few percent – precise values depend on the temperature of transformation and the composition of the steel. See Fig. 1 for an example of how the dilatation changes when a low-alloy steel is heated from room temperature to above its Ae3 temperature, where austenite is stable, and is then cooled back to room temperature.
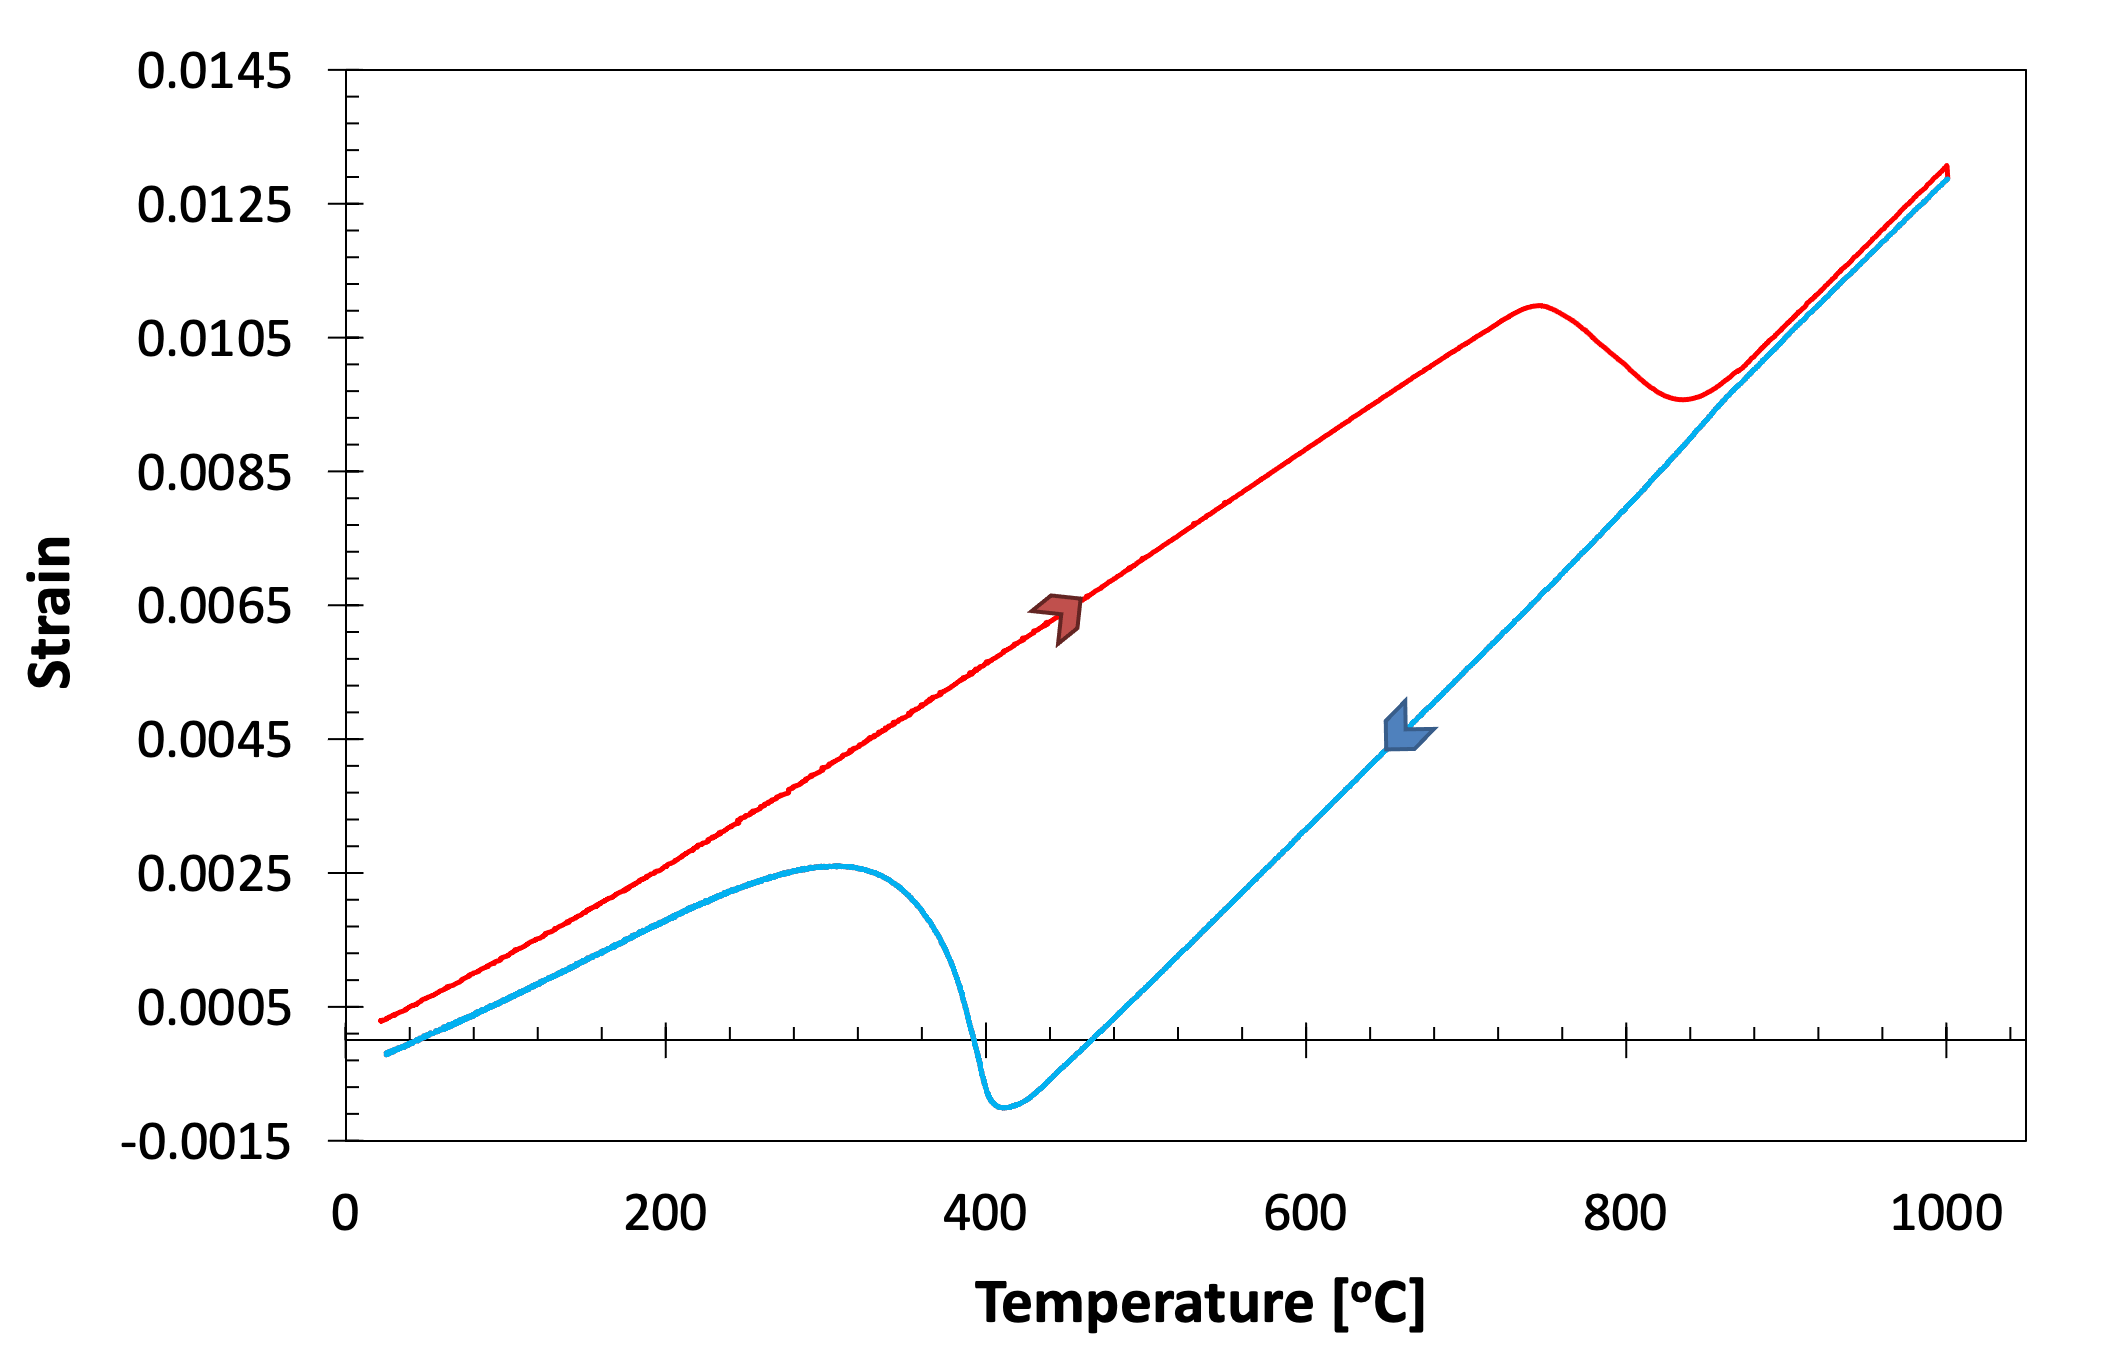 Figure 1. Dilatation curve for SA508 Grade 3 steel heated to 1000˚C at 20˚C s-1 and cooled to room temperature at 20˚C s-1. The transformation on cooling around 400˚C is that to martensite.
In the following document, we will consider the procedure for measuring the dilatation of low alloy steel samples (e.g., SA508 Grade 3) during heat treatments designed to replicate industrial heat treatments (e.g., austenitisation and quenching). This is referred to as quenching dilatometry to distinguish it from more standard dilatometry that is only concerned with the measurement of thermal expansion coefficients. The typical aims of carrying out quenching dilatometry are:
- To determine transformation start and finish temperatures (e.g., for martensite or bainite) for a particular steel during a non-isothermal heat treatment – typically austenitisation and quenching. This information can be used to construct a continuous cooling transformation (CCT) diagram or a continuous heating transformation (CHT) diagram. *To determine transformation start and finish time (e.g., for martensite or bainite) for a particular steel during an isothermal heat treatment, where the temperature is held constant. This information can be used to construct a time temperature transformation (TTT) diagram.
- To estimate the volume fractions of microstructural constituents present in the material after heat treatment (or examine their evolution over time). Such information can be used to the interpret or predict microstructures formed following heat treatment, and can also be used in the modelling of residual stress evolution during welding. **However, it is important to note that there are some key limitations to such estimations. See Section 1.1 below. **
For the low-alloy steels Rolls-Royce uses for plant construction, the principal interest is in CCT behaviour rather than TTT behaviour, since most steels are austenitised and quenched. The overall goal of such work is usually to be able to interpret (or predict) the microstructures that form during production heat treatments (e.g., the percentage bainite formed). Note that achieving this is not always straightforward through dilatometry alone, and the results of dilatometry should always be combined with techniques such as optical microscopy, scanning electron microscopy and microhardness to corroborate any conclusions drawn.
The remainder of this document will set out the standard procedures for carrying out quenching dilatometry measurements on low-alloy steels. Special focus will be given to austenitisation and quenching (CCT) investigations. The type of quenching dilatometer used is a so-called pushrod dilatometer, which uses ceramic pushrods to contact the sample in order to measure length change, as will be described in the following section. This by far the most common type of quenching dilatometer, and hence this document is written in reference to it.
The document begins by describing the typical experimental apparatus used for quenching dilatometry, including highlighting common choices for options such as quenching gas and pushrod material (Section 2). It then proceeds to talk about sample preparation considerations (Section 3), before detailing the technicalities of data acquisition (Section 4) and analysis (Section 5). Common artefacts and misinterpretations are highlighted in Section 6, ensuring data quality is addressed in Section 7, and complementary and alternative techniques are described in Section 8. Finally, a ‘How To’ guide for common experiments is given in Section 9.
1.1. Technique Limitations
Before proceeding, it is worth highlighting some key limitations to the technique:
- Only phase transformations that involve significant changes in sample length can be measured using dilatometry. Hence, it is useful for steels that display solid-state allotropic phase transitions on heating/cooling, but is less useful for examining precipitation in nickel alloys or aluminium alloys, unless there is a significant change in length or change in expansion coefficient associated with the event. In theory, assessing Ti alloys should be possible, since like steels they exhibit an allotropic transition (alpha to beta), but the author has often found that the strains associated with this can be difficult to interpret and are often not as strong as for steels.
- Sample sizes are typically no more than 4 mm diameter x 10 mm long. The technique measures the length change of the entire specimen only (it samples the whole volume at once). This may be significant where the steel exhibits compositional microsegregation (banding).
- Heating and cooling rates of up to 100˚C s-1 are usually achievable in a well-controlled manner in most alloys. Heating and cooling rates of 1000˚C s-1 are achievable, but samples usually need to be hollow, the material has to have high thermal conductivity, and rates may not be so controllable.
- Typical maximum temperature of 1600˚C, although measurements and/or control of temperature may be less good very high temperatures.
- It is difficult to assess volume fractions and start temperatures in mixed microstructures where there is overlap of transformations (e.g., bainite into martensite). Results should always be compared to those from microscopy and microhardness for a sanity check.
- Accurate measurement of volume fractions, following the procedure in Section 5.3 below, is difficult if there is a significant amount of retained austenite (with unknown volume fraction) at the end of the test, or under certain circumstances in which there is a significant amount of carbon partitioning to the austenite during transformation(s), since the procedure does not account for these occurrences.
2. Apparatus and Function
Fig. 2 shows some of the principal components of a pushrod dilatometer.
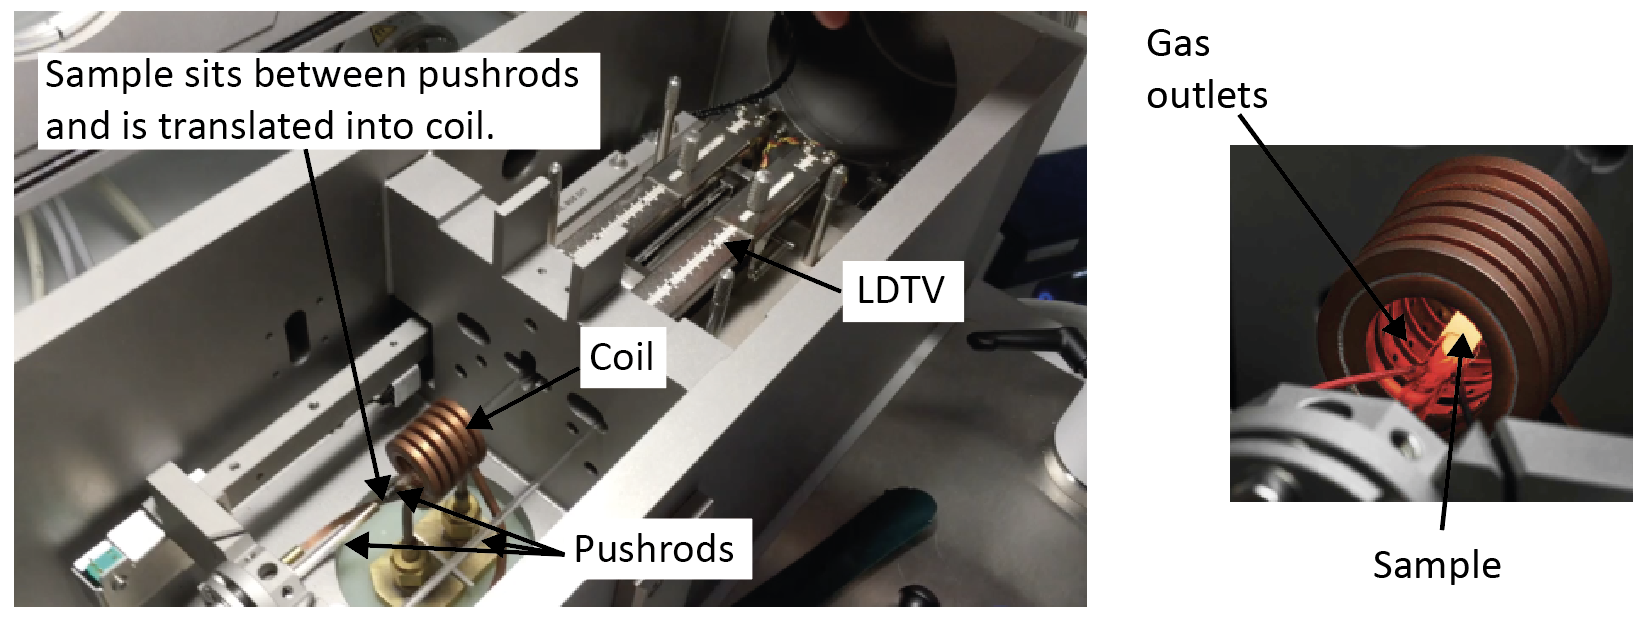 Figure 2. Photographs of the inside of a quenching dilatometer, with major components labelled. When operating, the sample would sit inside the heating coil (the pushrod assembly slides to translate the sample into the coil once loaded).
- The pushrods are used to transmit the sample change in length to the measuring system (see below). Two of them hold the sample in place during the heat treatment (there is a very small compressive force applied to sample) and are moved when the sample changes length. The third acts as a reference.
- The pushrods are usually either silica quartz or alumina. It is recommended to use silica quartz for all heat treatments that do not involve an excursion at or above 1200˚C for over 30 seconds. For heat treatments that do go to such high temperatures for prolonged periods, alumina pushrods should be used.
- A linear variable differential transformer (LDTV) module measures the dilatation.
- Heating is usually provided by an induction coil, which itself is water cooled (by internal water circulation). The water cooling of the coil also aids to cool to the sample although this is principally achieved (particularly at high cooling rates) using a quenching gas (water does not flow onto or through the sample itself, but the water-cooled coil acts to cool the environment).
- An inert gas is typically used to control the rate of cooling during quenching processes. This gas is delivered, under pressure, into the chamber to directly impinge on the sample. This is usually achieved by the gas blowing onto the sample from numerous holes in the induction coil, which also includes a gas channel as well as a water cooling channel. When using a hollow sample the gas can be blown through the centre of the sample to further increase the cooling rate. The gas can also be used as an inert environment (most machines can operate under vacuum or inert gas atmosphere). However, care must be taken as using an inert gas atmosphere at high temperatures can lead to decarburisation in some cases, as discussed later in Section 4.1.
- Ar and He are the usual choices for inert gas. He is more expensive, but has a higher conductivity and can be used to cool the sample to sub-zero temperatures by being cooled in liquid nitrogen.
- Thermocouples are used to monitor the temperature of the sample and provide the feedback for control of heating/quenching gas. Type S are most common to typical steel heat treatments, whilst Type K might be used for sub-zero work.
3. Sample Geometries and Preparation
The sample geometries for most quenching dilatometry are cylindrical specimens that match the diameters of the pushrods and sit with their full lengths inside the induction coil. Typically, samples measure 4 mm in diameter by 10 mm long. Larger diameters and non-cylindrical geometries are possible, but they must fit within the heating coil.
3.1. Quenching Speed Considerations
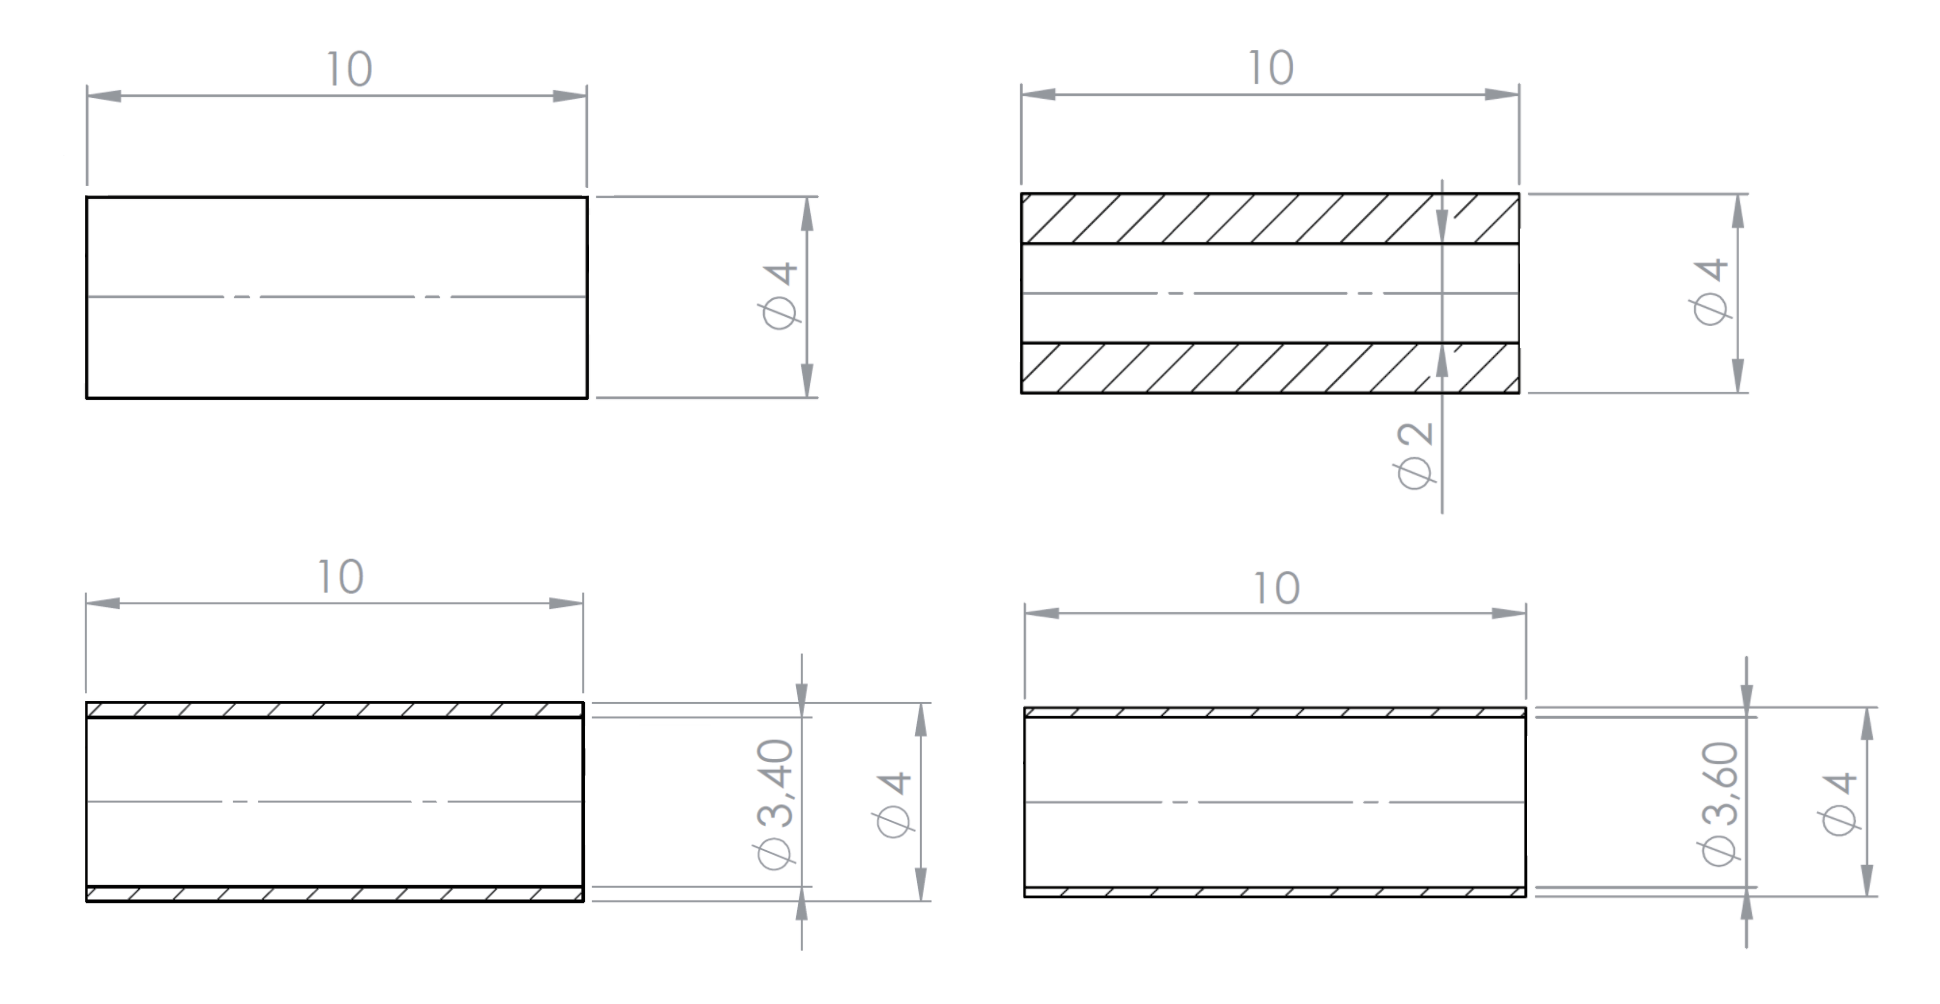
For the fastest heating and cooling rates, the sample mass may need to be reduced. This is achieved, typically, by using hollow samples. Examples of technical drawings of various hollow samples are provided in Appendix 1.
3.2. Surface Finish
The surface finish of the at ends of the specimens needs to be very good and the ends need to be as close to parallel as possible. Concentric machining marks, such as those due to machining, should be removed. This can be achieved quickly and effectively using SiC grinding paper and an appropriate jig to keep the ends flat and parallel. The surface finish of the circumferential surface of the cylindrical samples is less important, but does need to be amenable to thermocouple attachment.
3.3. Homogeneity and Orientation
A dilatometry measurement will sample the behaviour of the whole sample volume and provide an averaged signal for all the material contained within it. Hence, any in-homogeneity within the sample volume (in terms of chemistry, levels of deformation, crystallographic texture, etc) will influence the overall dilatation measured. This needs to be accounted for when preparing samples and interpreting results.
4. Data Acquisition
The data acquisition stage of a dilatometry experiment is a relatively standard procedure, which involves programming in the temperature steps of interest (either holding, cooling or heating steps) and requesting the number of data points to be acquired. Typically, only linear profiles can be used for each step, but programmes can contain many steps (usually 50+), so curves can be recreated by inputting many small linear steps. Example heat treatment profiles are shown in Fig. 3.
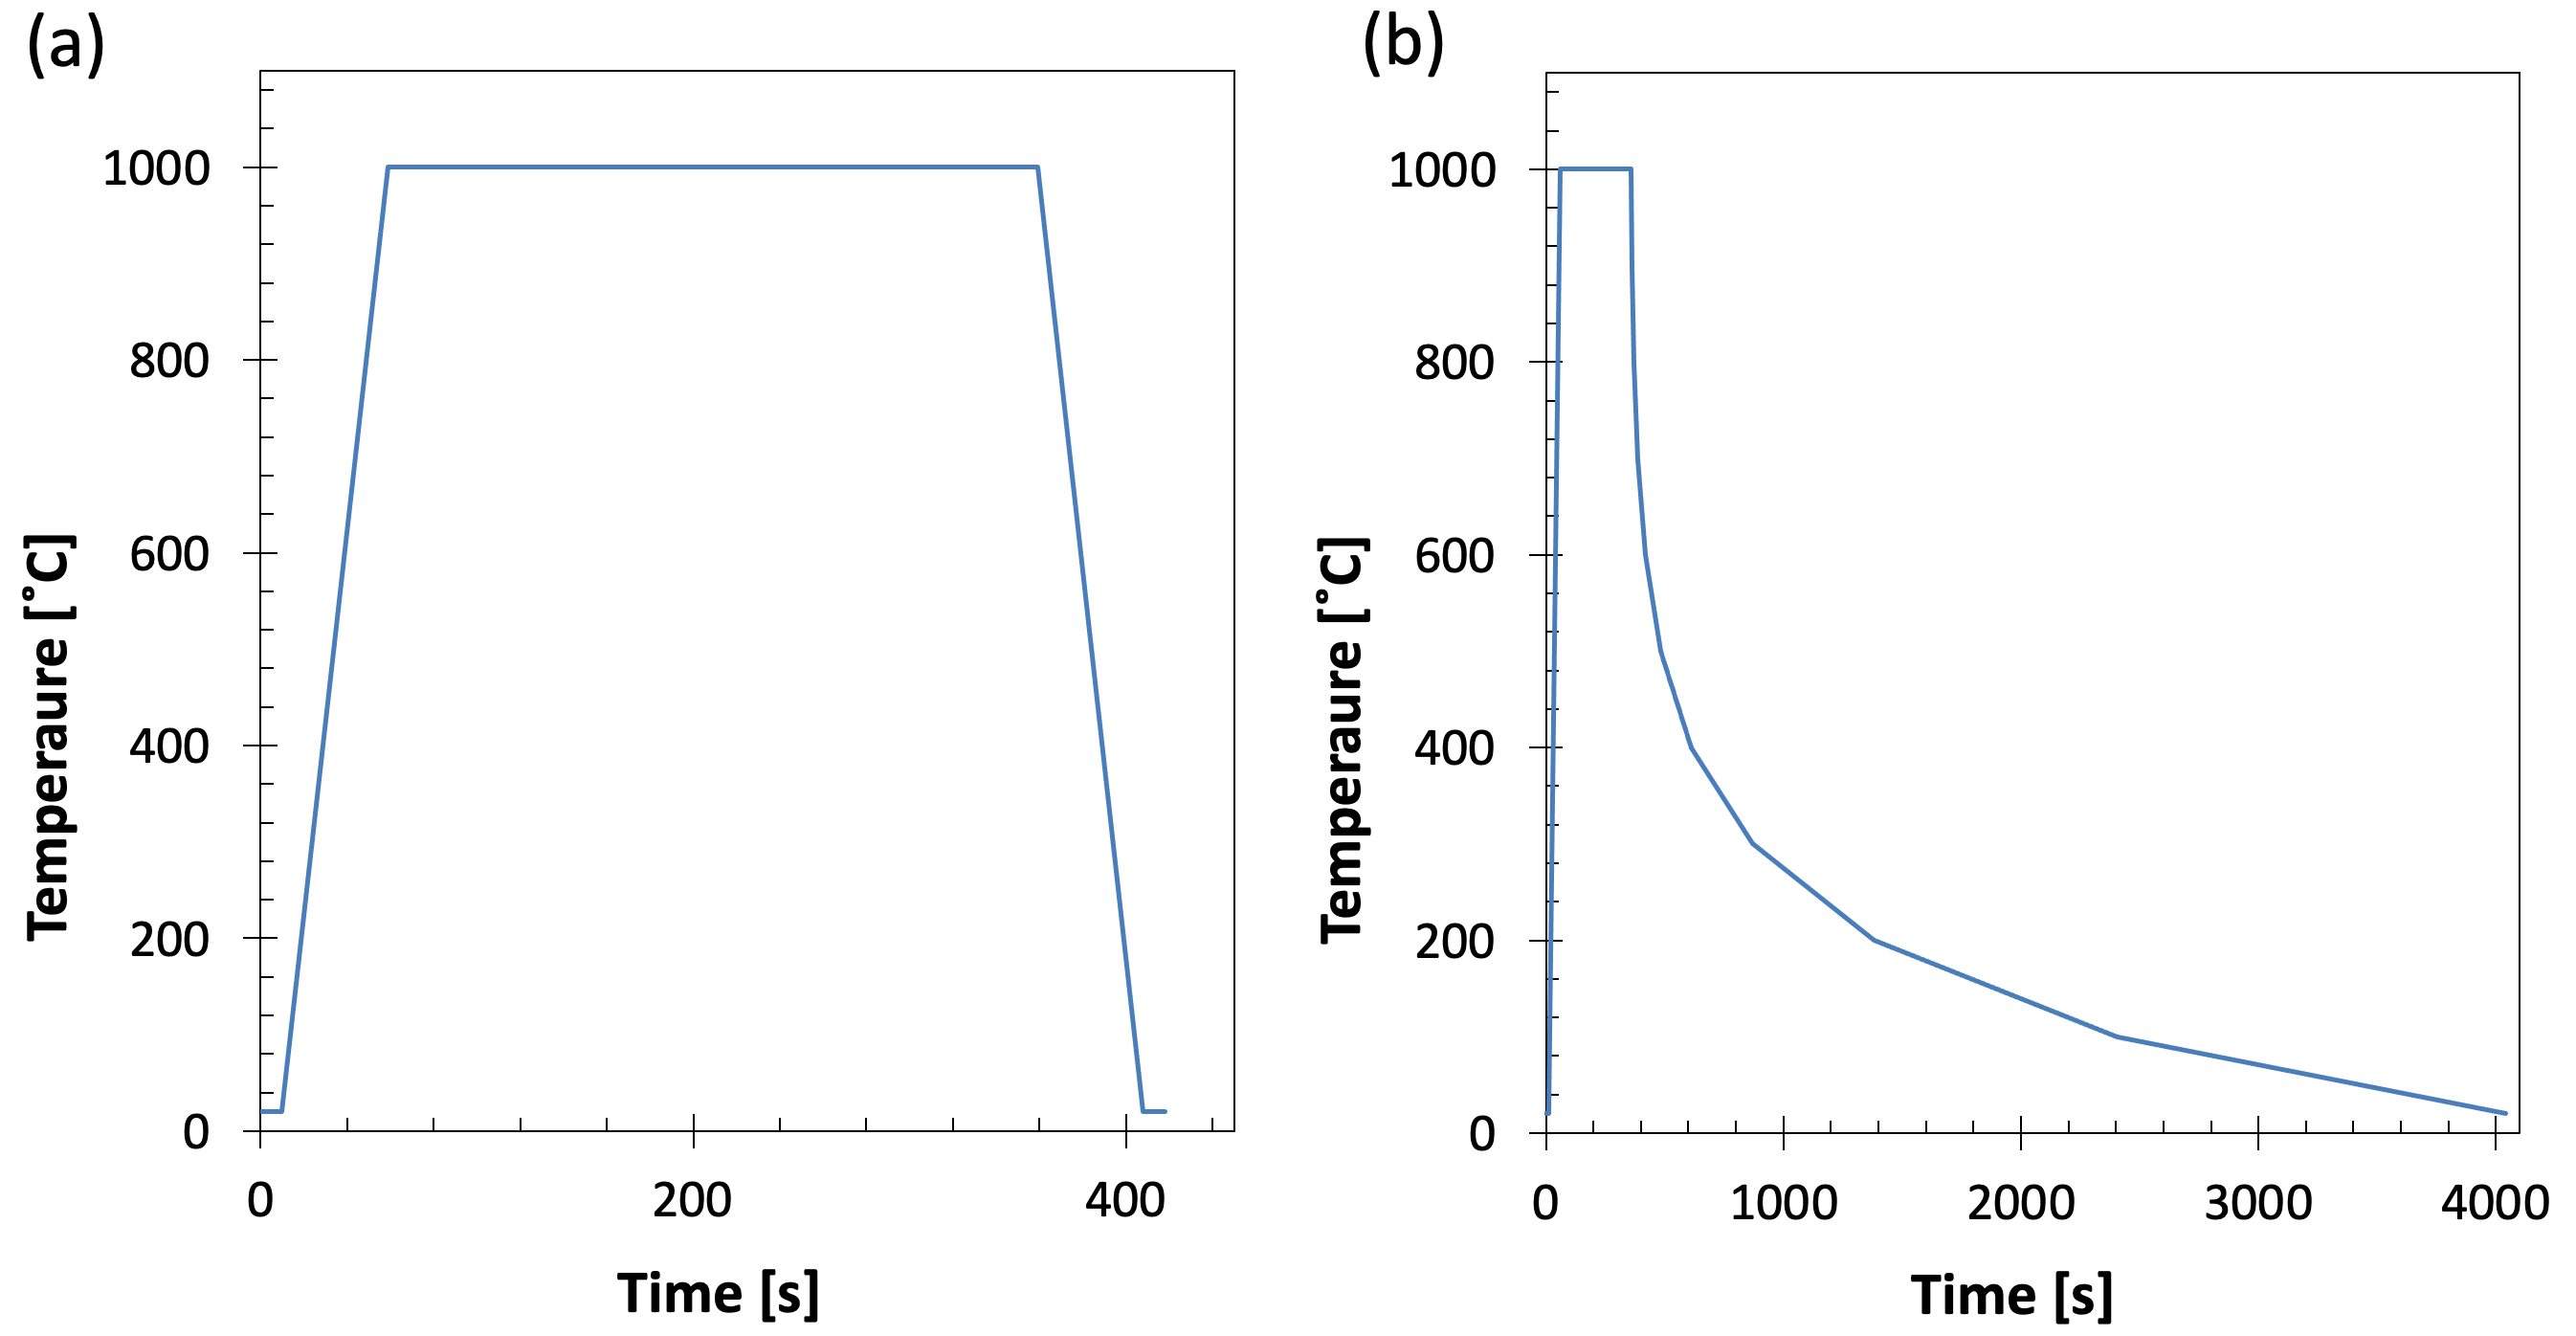 Figure 3. Example heat treatment profiles. (a) Austenitisation at 1000˚C for 5 minutes with cooling and heating at 20˚C s-1. (b) Cooling from austenitisation in which the rate is changed every 100˚C.
The number of data points acquired per programme is usually limited, so more points should be allocated to the steps of interest. Measurement frequencies of over 1000 Hz are possible, but may not always be practical. Thermocouples are typically sensitive to ± 0.1˚C, so gathering data with much greater frequency than every 0.1˚C of cooling or heating is unnecessary.
4.1. Heating and Austenitisation
Programmes used to construct CCT curves will need to start with heating and austenitisation steps to set the prior austenite grain size. The speed of heating, hold temperature and hold time can all have a large influence on the grain size.
For heat treatments involving prolonged high-temperature holds (>1000˚C), it has previously been recommended that a partial pressure of inert gas be used as the environment, rather than vacuum. This is to prevent oxide from subliming from the sample surface and coating the chamber. However, prolonged holding under inert gas atmosphere has recently been found to lead to decarburisation of samples in some cases. In such cases, it is recommended austenitisation be performed under vacuum where possible, and that the surfaces of samples are cleaned of any oxide (e.g., by quick hand grinding using SiC paper) before being run. Tests should be performed in each case to assess whether holding under vacuum or under inert gas is preferrable.
Regarding heat rates – for the fastest heating rates a vacuum will be required, although relatively fast heating rates may still be attained using an inert atmosphere (a few hundred °C s-1).
4.2. Quenching
The speed of quenching will determine which microstructural constituents form (ferrite/ pearlite/bainite/martensite). Quenching with inert gas is usually necessary for all but the slowest cooling rates (around 0.1 C s-1). For the fastest cooling rates, He gas will be required. The gas can be introduced (switched on) during the first cooling step after an experiment has started under a vacuum (so it can run under vacuum until the first cool requiring gas), although this may lead to ‘blips’ in the data recorded (see section 6).
4.3. PID Controls
Accurate control of sample heating and cooling is not a trivial task when the rates of doing so are high (>50˚C s-1), particularly when samples are being heated to high temperatures. Proportional–integral–derivative (PID) controls should be altered to tune both the heating power and the quenching gas (there are usually separate controls for each).
For example, by tuning the PID settings, significant overshoots in temperature on fast heating can be suppressed, see Fig. 4. Different PID settings are usually required for the particular geometry and thermal conductivity of the sample.
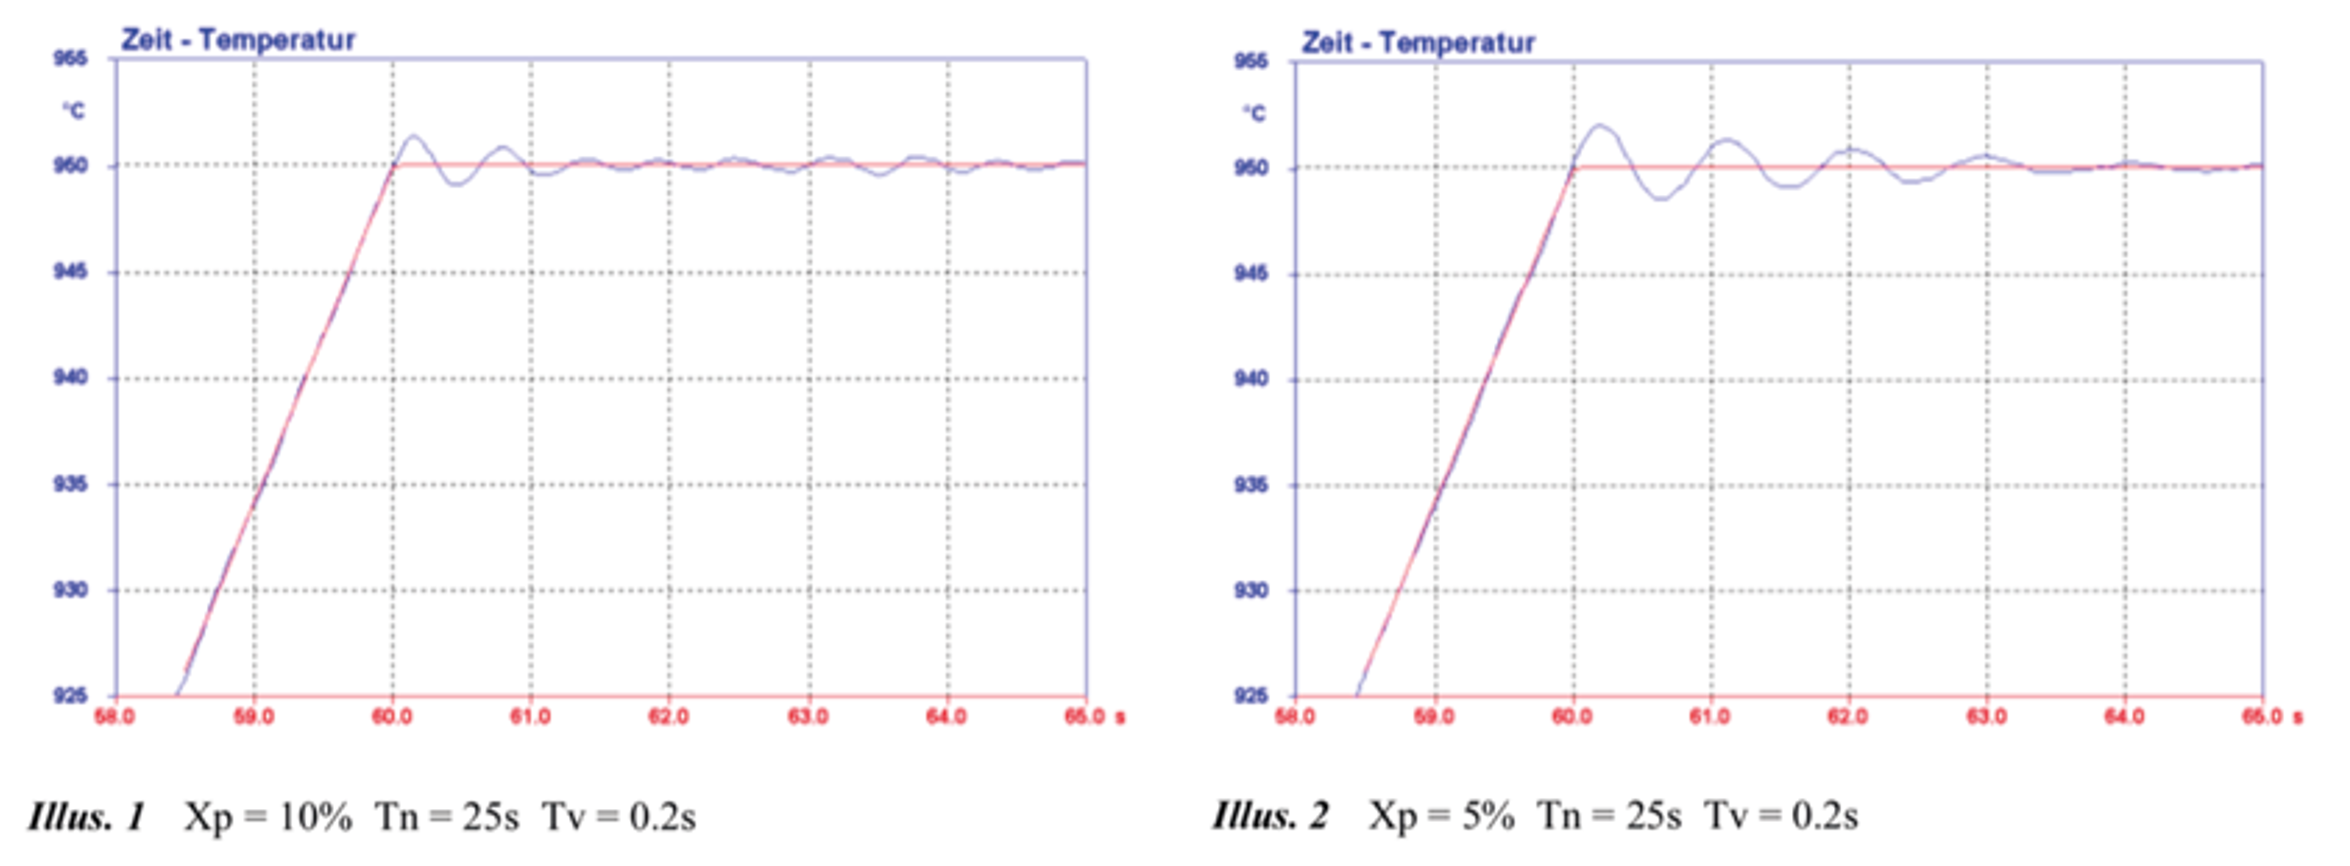 Figure 4. Examples of the effect of changing the PID settings on the temperature control (taken from TA instruction manual for DIL805A/D/T).
4.4. Temperature Uniformity
Temperature uniformity is often a concern for dilatometry experimentalists – ideally, the temperature should be constant all through the sample volume during the test. This is never achievable in reality, but at heating and cooling rates <10˚C s-1 the differences in heat treatment experienced in different areas of the sample (assuming standard 4 mm diameter x 10 mm long dimensions) should be negligible for steels.
The action of the induction heating will mean that the sample is always hottest at its centre. This can have a big effect when heating samples at high heating rates to high temperatures – the centre of the sample can overshoot the set temperature considerably, leading to the outside of the sample also overshooting. This may be mitigated to a great extent using a thin-walled hollow sample. Simple FEM models of quenching from austenitisation have suggested, for a non-hollow sample, the temperature difference between the very centre and edge of the sample at mid length is not more than 1˚C at cooling rates of 5˚C s-1 and below. However, it may reach around 10˚C at 50˚C s-1.
Temperature uniformity along sample length can be monitored by placing one thermocouple at the sample centre and welding another nearer the sample’s end. For typical heat treatment cycles to produce a CCT, temperature gradients along the lengths of samples tend to be small (illustrative data to be collected). However, significant gradients can exist when samples are held above 1000˚C, owing to heat loss to the pushrods. The heat loss to the pushrods can also change according to the pushrod material.
4.5. Sub-Zero Quenching
It is possible on some dilatometers to quench samples to below room temperature (down to -150˚C) by passing He gas through a heat exchanger submerged in liquid nitrogen. However, such experiments are not trivial to carry out, and results seen by the author have often contained artefacts (such as non-linear dilatation curves below room temperature, when zero transformation would have been expected).
4.6. Safety and Machine Preservation
Heat treatments that involve very high temperatures (>1200˚C) should be carefully monitored to ensure that no instabilities begin to develop. Over-compensation for drops in temperature can develop into such instabilities and large variations in the input power (and temperature) that can eventually melt the sample. Localised sample melting can also occur during high temperature holds if significant segregation is present. The authors have also observed localised melting around thermocouple wires during holds >1300˚C, although the origins of this are unclear.
The use of a partial pressure of gas is generally advised at very high temperatures to suppress sublimination of species. However, as highlighted in Section 4.1, holding at high temperature with an inert gas atmosphere can lead to unwanted decarburisation in some cases, so this should be accounted for.
In general, during prolonged holds at any temperature, the maximum power of the machine should be limited such that accidental overheating (and melting) of the sample is not possible. This can be achieved by selecting the maximum possible HF power during each heat treatment step.
5. Data Analysis
The principal data extracted from a dilatometry experiment are change in sample length and the sample temperature. The change in length can easily be converted to strain by dividing by the original sample length (around 10 mm).
5.1. Transformation Start and Finish Temperatures
The transformations from ferrite to austenite and austenite to ferrite involve deviations in dilatometry curves as shown in Fig. 1. We can associate a start temperature for these transformations, but it is not always easy to do so – just as it is not obvious how to define a yield point for an alloy with a gradual transition to plastic behaviour. Two methods are highlighted below.
5.1.1. The Offset Method
In the offset method is the recommended method for transformations that are preceded by periods of no transformation (which yield regions of linear dilatation). Essentially, the method involves taking the gradient of the curve pre-transformation, and offsetting this from the curve by a particular amount. The transformation temperature is defined as that when the offset curve meets the experimental data, see Fig. 5 for an example of transformation start during cooling. It is analogous to the 0.2% proof stress method of determining yield strength.
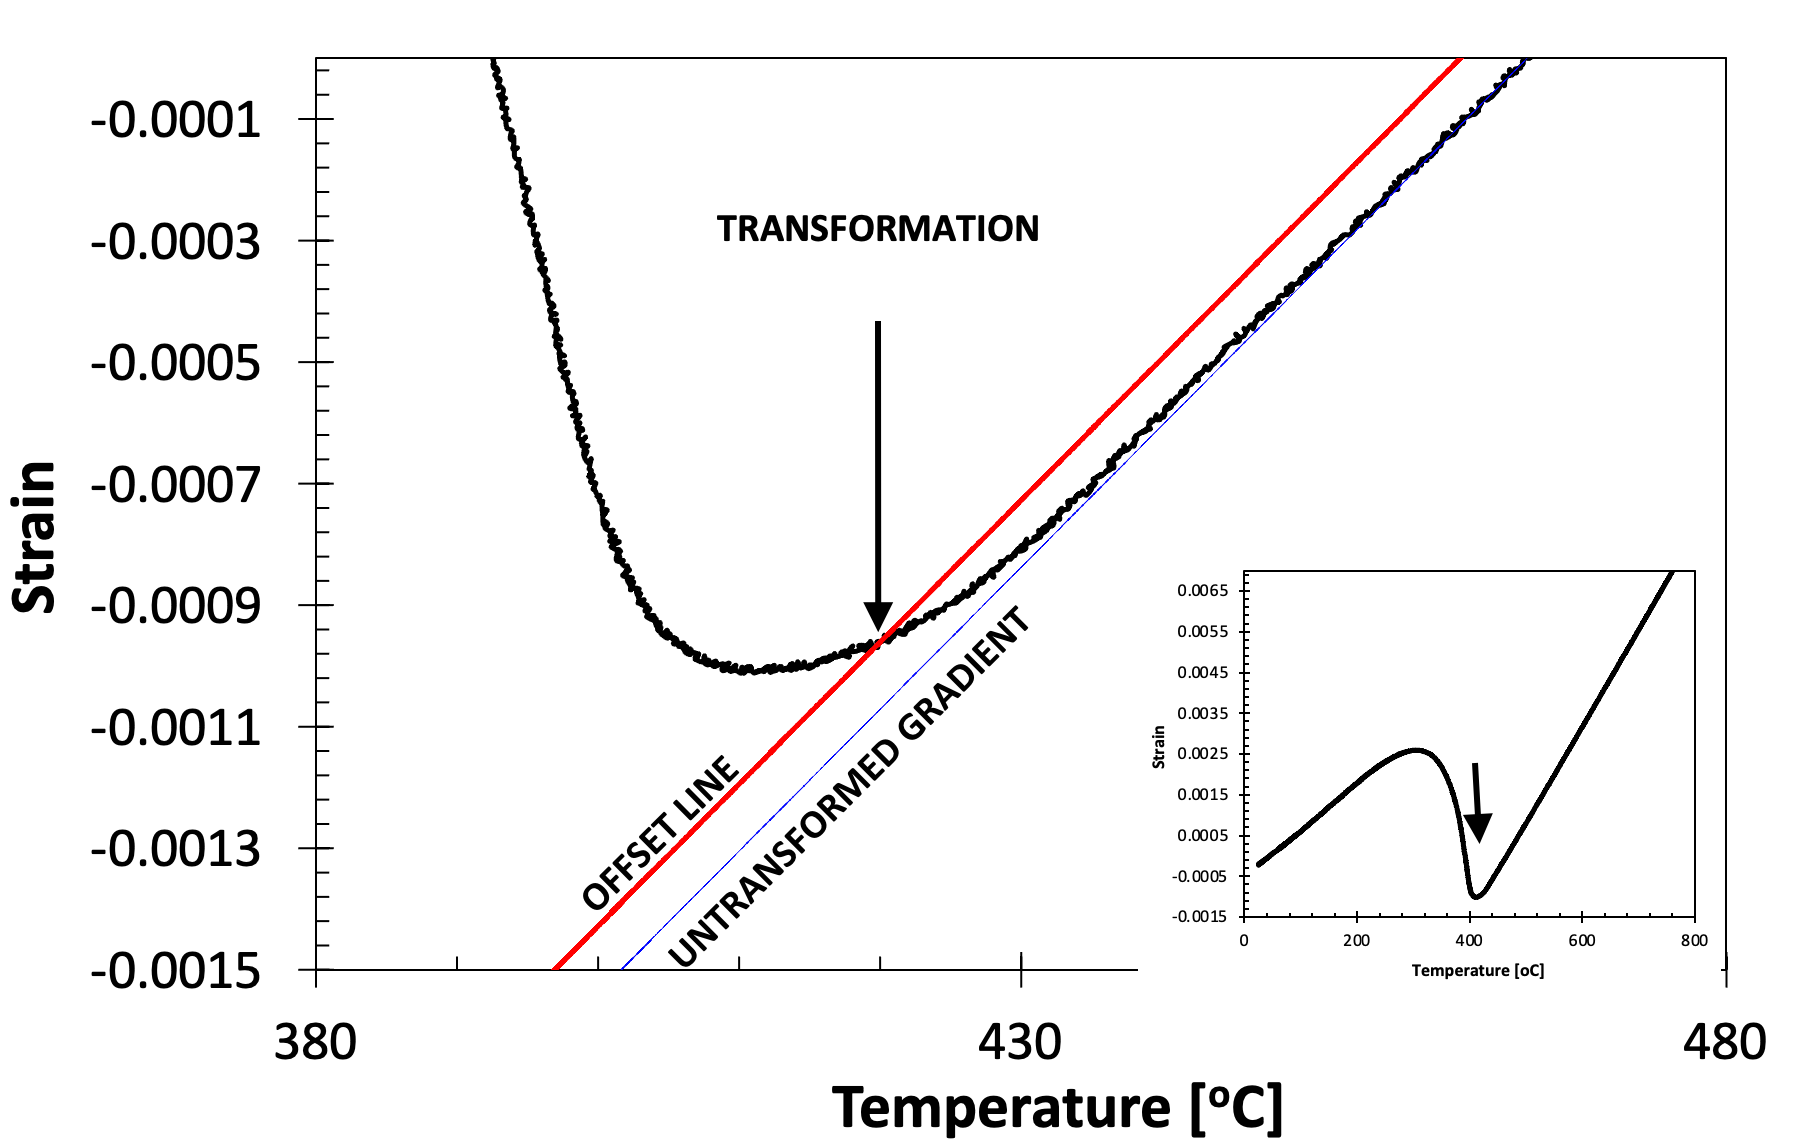 Figure 5. Showing the application of the offset method to determine the martensite start temperature of an SA508 Grade 3 steel quenched at 20˚C s-1 (full cooling curve shown inset).
The offset method discussed here is that proposed by Yang and Bhadeshia [1]. They used a constant offset for all samples of a given steel, corresponding to the strain for transformation to 1% martensite (i.e., the strain that would be expected if 1% martensite formed in 100% austenite at room temperature). The strain corresponding to 1% martensite can be found by computing the lattice parameters of the austenite and martensite, which in turn depend on the alloy composition. Spreadsheets for the calculation of the offset strain (computed using empirical formulae for lattice parameters) can be found here: http://www.phase-trans.msm.cam.ac.uk/2007/mart.html (both spreadsheets contain the same calculations, which are also repeated in the paper). Additionally, a Jupyter Notebook has been provided for users to quickly calculate the offset strain in an IPython environment. This can be found in the ‘Analysis codes’ section for this experiment, titled “Offset_Calculator.ipynb”. Furthermore, a Jupyter Notebook for directly calculating transformation start temperatures has also been provided in the ‘Analysis codes’, titled “Transformation_Ts_Calculator.ipynb”. This notebook has been setup so that users test a variety of offset gradients (3 recommended), over a range of temperatures, so that any uncertainties can be quantified.
The offset can be applied to assess finish temperatures in an identical fashion, with the offset being applied to the transformed curve, see Fig. 6 for example during cooling. Note that the method to assess finish temperature on cooling is equivalent to that to assess start temperature on heating.
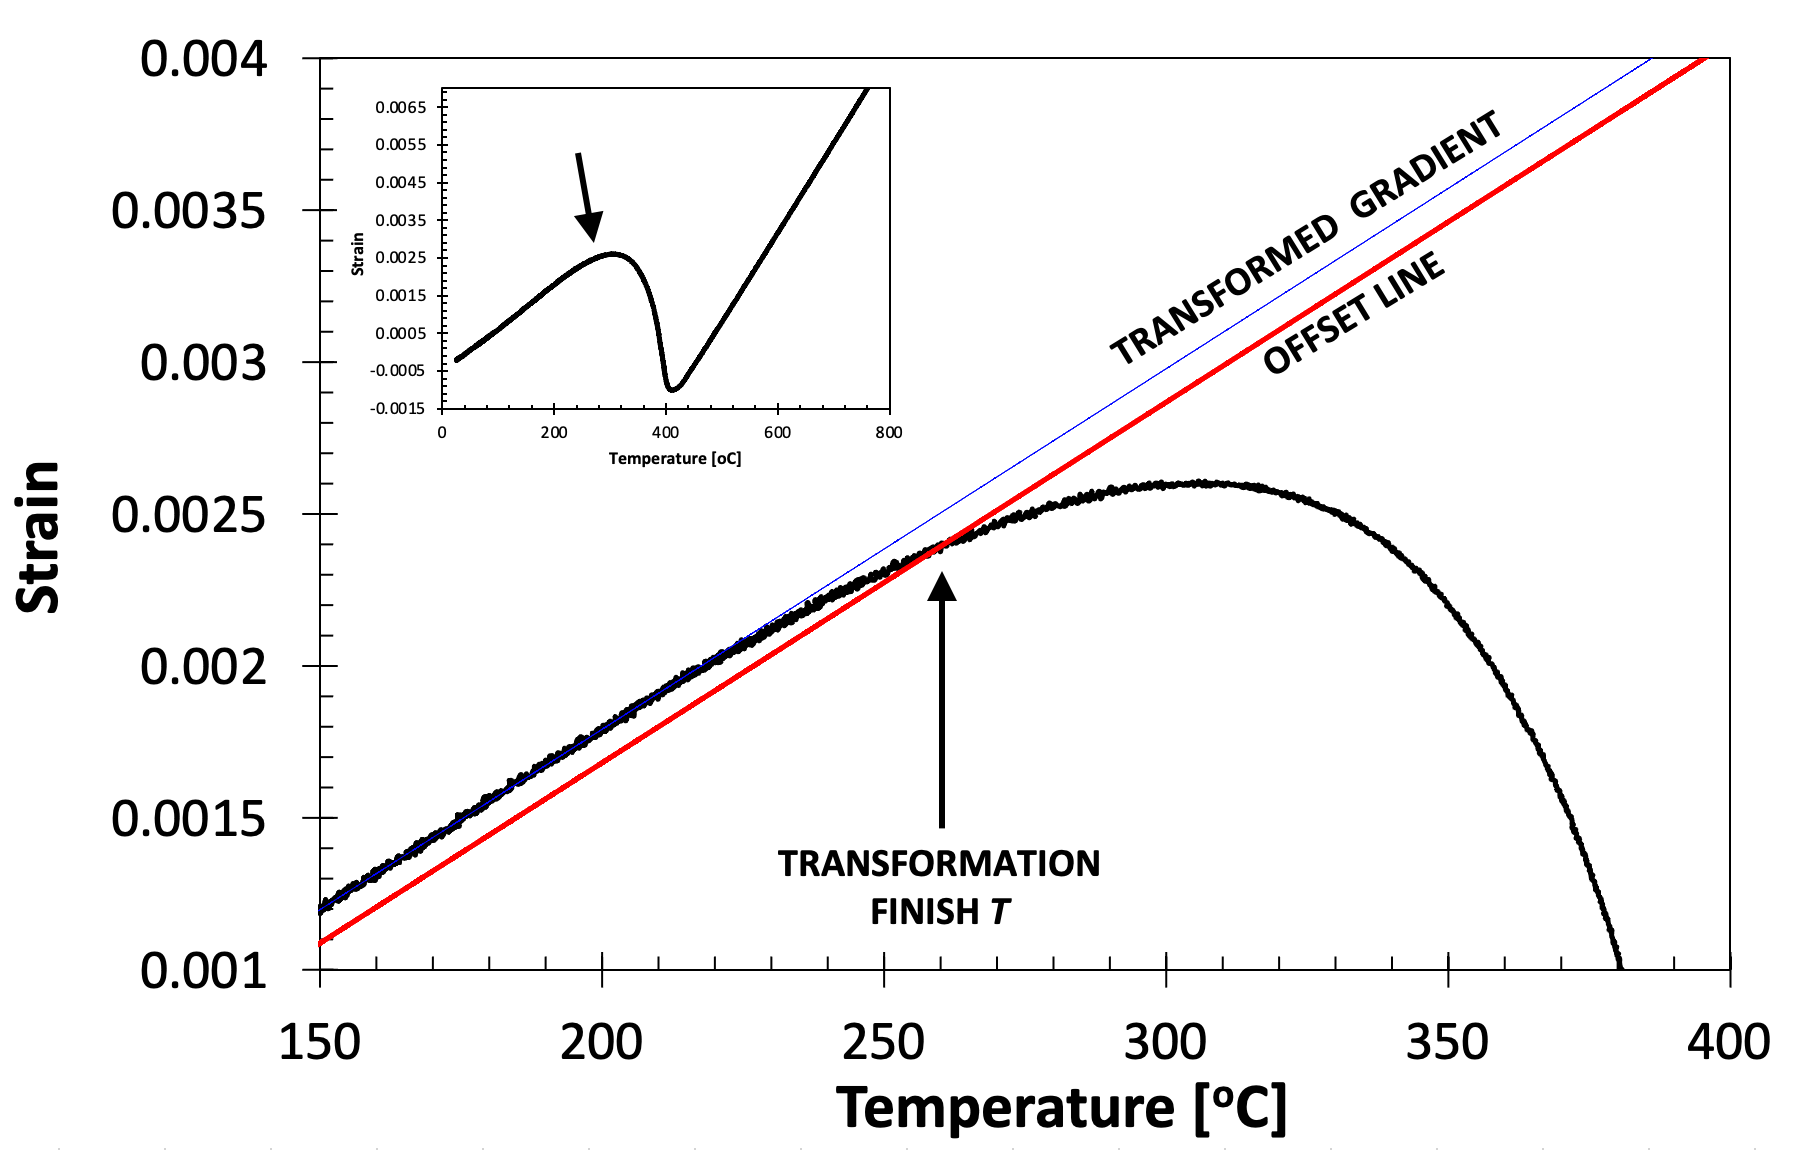 Figure 6. Showing the application of the offset method to determine the martensite finish temperature of an SA508 Grade 3 steel quenched at 20˚C s-1 (full cooling curve shown inset).
One difficulty associated with the offset method is that there is no prescribed region over which the gradient of the untransformed (or transformed) curves should be assessed (i.e., what temperature interval). **However, it is recommended that the gradient be taken over at least a 50˚C temperature range, at least 50˚C away from the approximate transformation start temperature. **
The offset method can be used when two or more transformation events occur during heating or cooling, as long as they are separated by an interval of no transformation in which the gradient can be measured. An example of this is shown in Fig. 7, which shows a high-temperature transformation to ferrite followed by a transformation to bainite at lower temperatures.
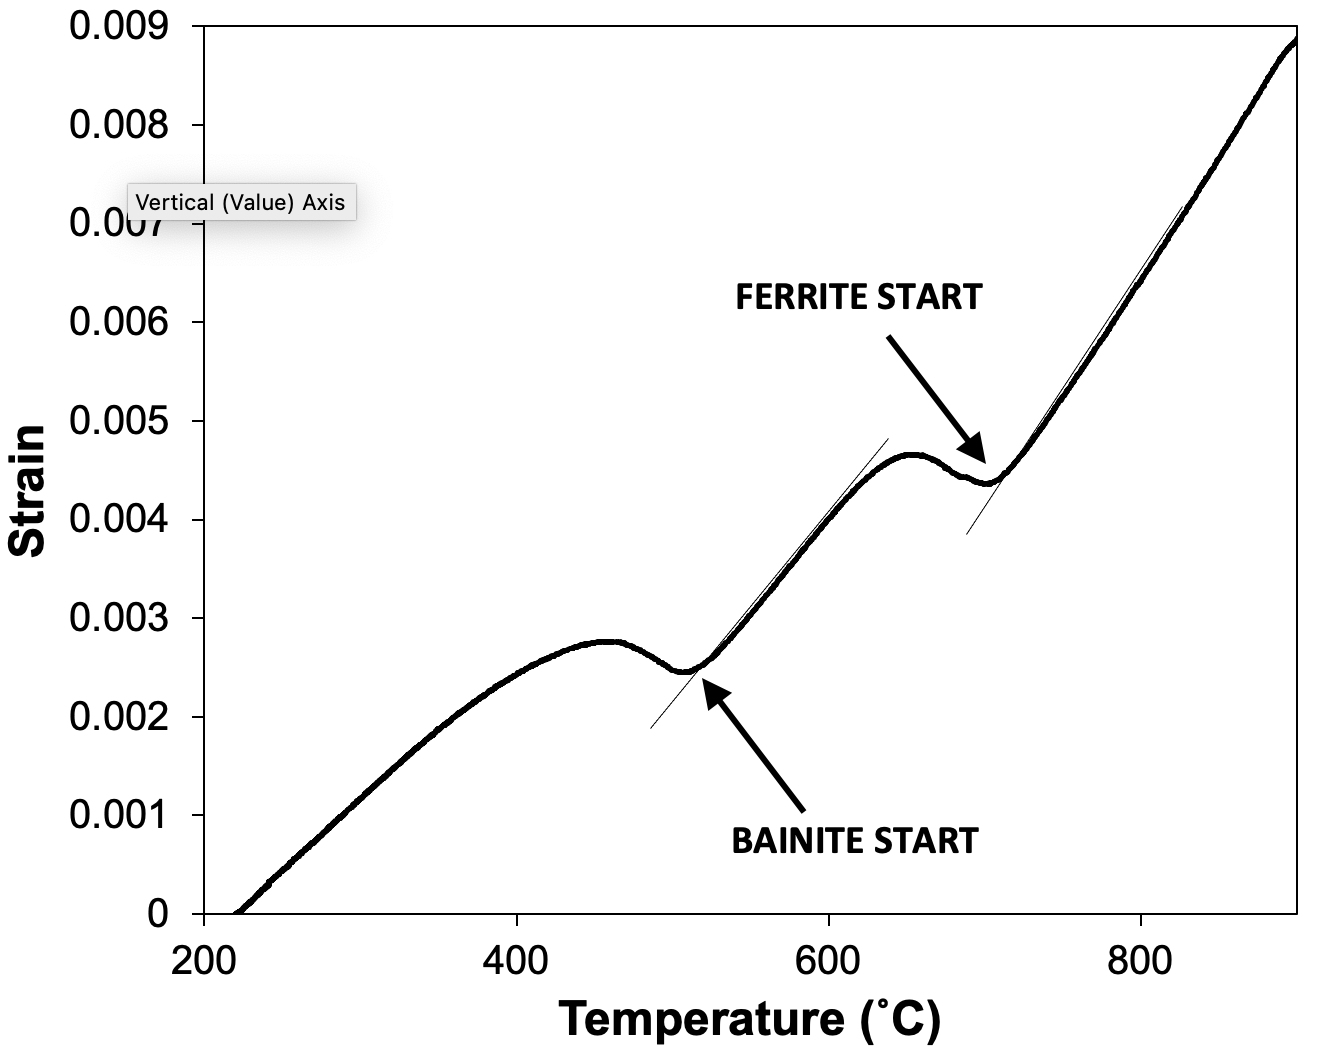 Figure 7. Schematising how the offset method can be used to determine the start temperatures of sequential reactions, so long as there is a linear portion of the curve between the transformations.
5.1.2. 2nd Derivative
The offset method is the recommended method of determining start temperatures when the transformation is preceded by a period of no transformation activity. However, there may be cases in which there is no linear region of dilatation before a transformation occurs. This is found to be the case when one transformation immediately follows another, such as in Fig. 8 where a martensite transformation occurs directly after a bainite transformation.
Here, the only indication of a transformation is the change in curvature of the transformation curve (as highlighted in the figure). This can be assessed using the second derivative of the curve, which should change sign when the curvature switches. The transformation temperature is that at which the second derivative is equal to zero.
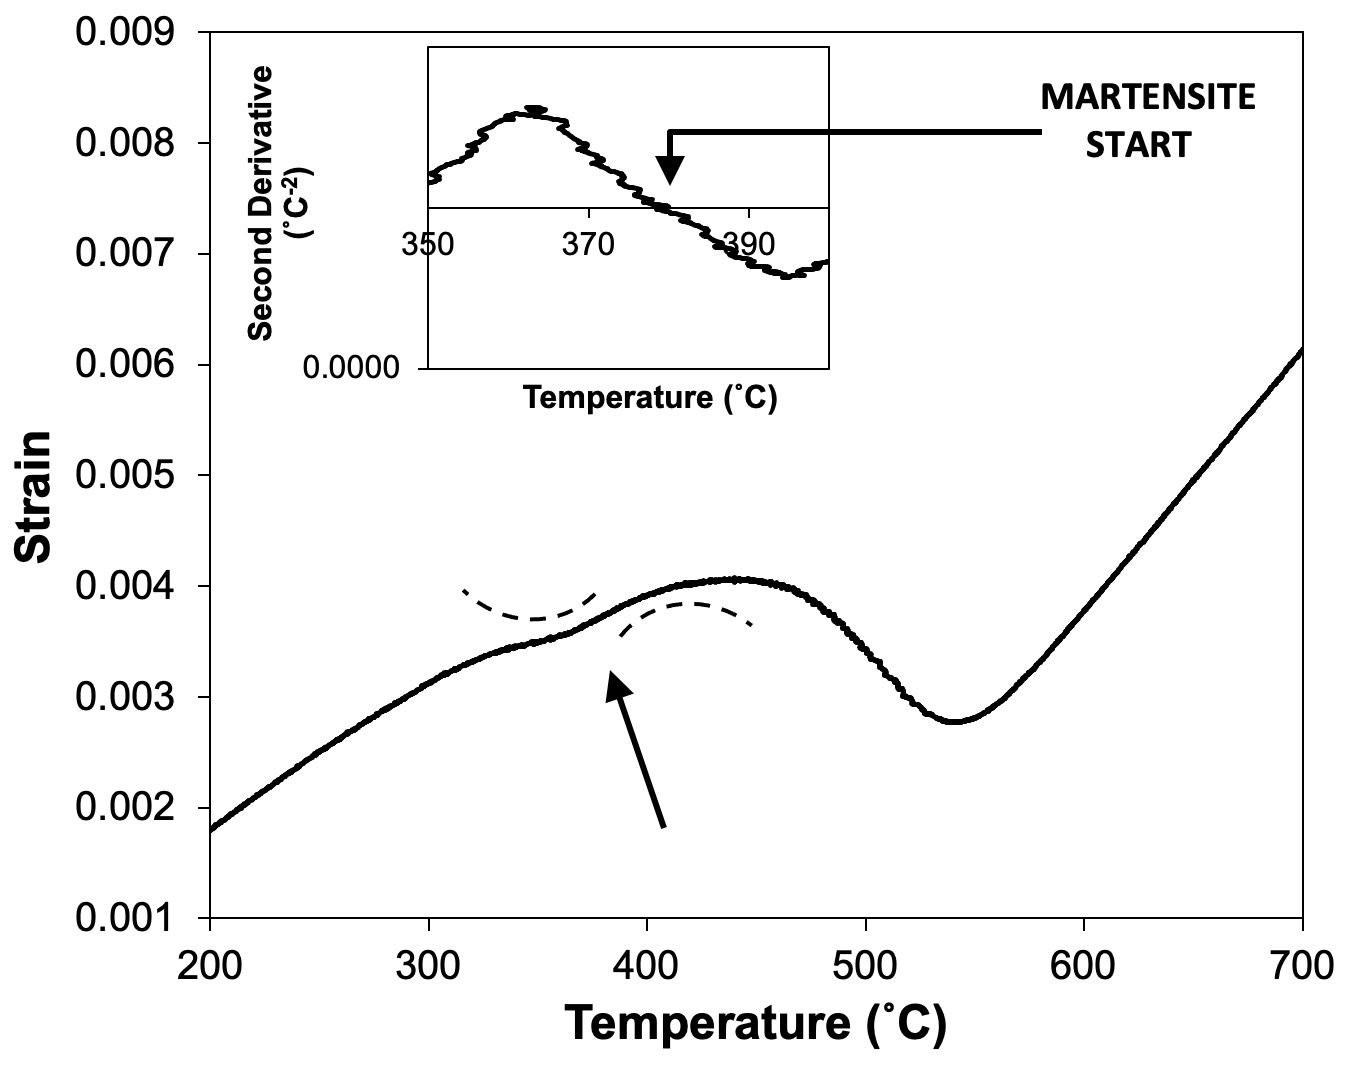 Figure 8. Showing the application of the offset method to assess the likely martensite start temperature for a sample that has already undergone a partial transformation to bainite. The change in curvature around 380˚C is schematised using the dashed curves.
The second derivative of a curve can be calculated quite straightforwardly, e.g., using the gradient function in an Excel spreadsheet. However, there is one key complication, and that is the temperature range over which the second derivative is taken. If this is too short, the derivative picks up noise in the data and is noisy itself. If it is too long, changes in curvature may be averaged out. For Fig. 8, the second derivative was taken over a 10˚C temperature range, but several ranges should be tried to assess the best outcome and the uncertainty involved in the method.
5.2. Uncertainties in Start/Finish Temperatures
There are several sources of uncertainty associated with the acquisition of data during a single dilatometry test, and its subsequent analysis to obtain start and finish temperatures. For the offset method, these include:
- Noise in the change in length signal, typically ±0.1 µm, which leads to an uncertainty in start temperature, typically around ±2˚C.
- Uncertainty associated with finding the gradient to apply the offset to (i.e., the temperature range over which the gradient is evaluated can change the gradient itself). The author has found that this can often introduce large uncertainties (±40˚C), particularly when the start transformation involves a dilation that is not particularly steep.
However, for a repeat test with a consistent analysis method (i.e., gradient evaluation procedure), there are two sources of uncertainty or scatter that often dominate:
- Sample-to-sample variations, which can be caused by small differences in alloy composition, differences in sample geometry (which can influence temperature uniformity) or differences in experimental conditions (e.g., placement of sample between pushrods).
- Temperature non-uniformities can exist within a sample during heating, holding and cooling stages, in particular during fast heating and cooling owing to where the heat is generated or extracted.
Typically, one finds that combining all these sources of uncertainty, the scatter in start temperature is not greater than ±20˚C for a single heat treatment cycle with a consistent offset methodology, and can be much smaller. The only cases in which greater uncertainty is often encountered are cases in which transformations are evaluated for high heating and cooling rates (50˚C s-1 and above). In these cases, there are a number of artefacts that can be problematic (see Section 6), and temperature uniformity will be poor.
The above uncertainties only refer to one particular heat treatment and analysis method. One could, of course, be interested in how martensite start temperature varies with cooling rate. However, assessing the uncertainty introduced by changing the cooling rate is not trivial, since there are likely to be metallurgical reasons why start temperature would change with cooling rate (e.g., the austenite grain size may be higher for slower cools).
Similar sources of uncertainty are also present for the 2nd derivative method. The temperature interval over which the derivative is taken can be varied to give an idea of the uncertainty in the method. However, sample-to-sample variations and temperature non-uniformities tend to dominate, as for the offset method.
5.3. Volume Fraction Transformed
The volume fraction transformed can be estimated from dilatometry data by assuming the evolution of strain follows a lever rule type relationship. For a general transformation, this can be written:
fraction transformed = \(\frac{\varepsilon - \varepsilon_\textrm{untransformed}}{\varepsilon_\textrm{transformed} - \varepsilon_\textrm{untransformed}}\)
For transformation(s) on cooling (from austenite to ferrite), the following can be written:
fraction transformed = \(\frac{\varepsilon - \varepsilon_\gamma}{\varepsilon_\alpha - \varepsilon_\gamma}\)
Where (\varepsilon) is the strain from the dilatation curve at a particular temperature, (\varepsilon_\alpha) is the strain from the extrapolated transformed gradient (assumed to be ferrite, hence the α notation) at the same temperature, and (\varepsilon_\gamma) is the strain from the extrapolated untransformed curve (assumed to be austenite) again at the same temperature. This is schematised here:
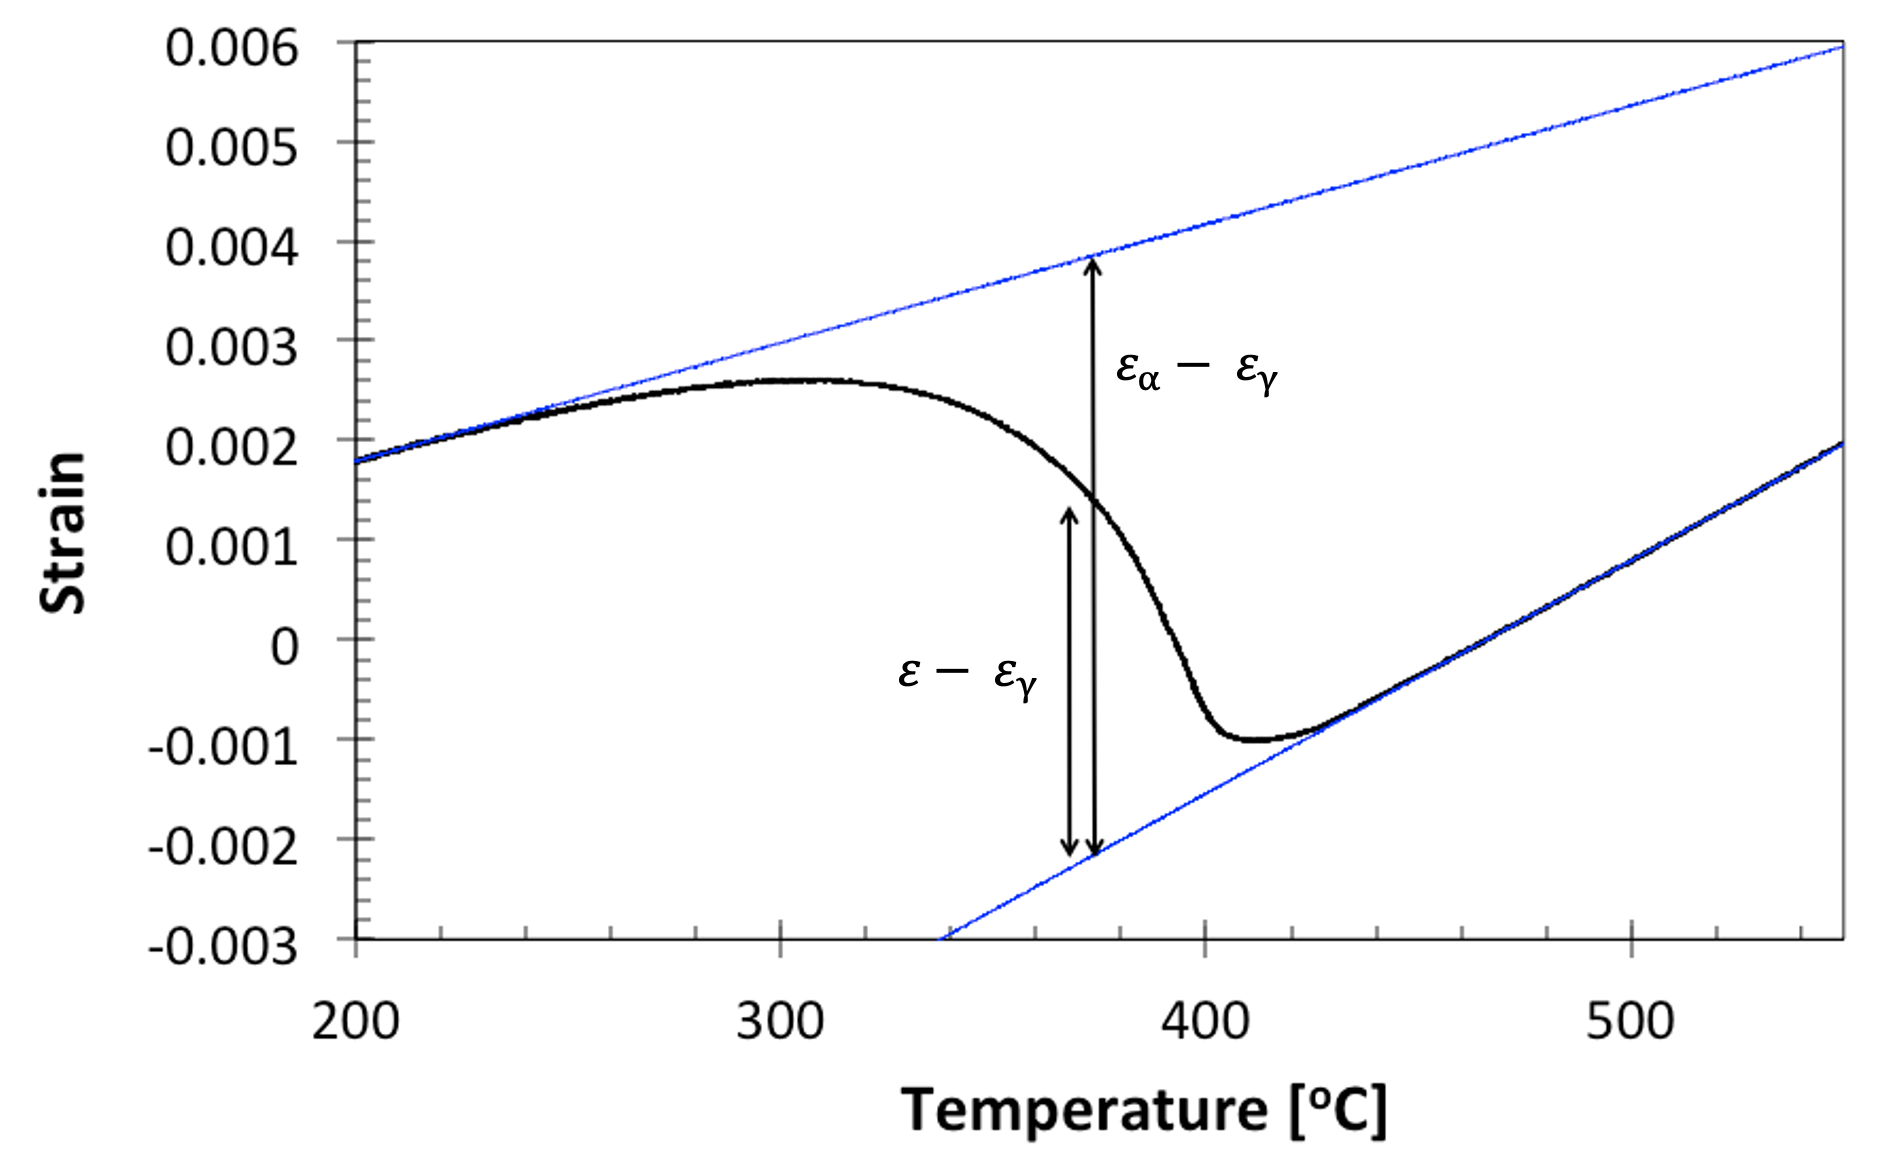 Figure 9. Schematising the calculation of fraction transformed from a dilatation curve on cooling from austenite to ferrite (martensite in this case).
And the resulting transformation curve from Fig. 9 is:
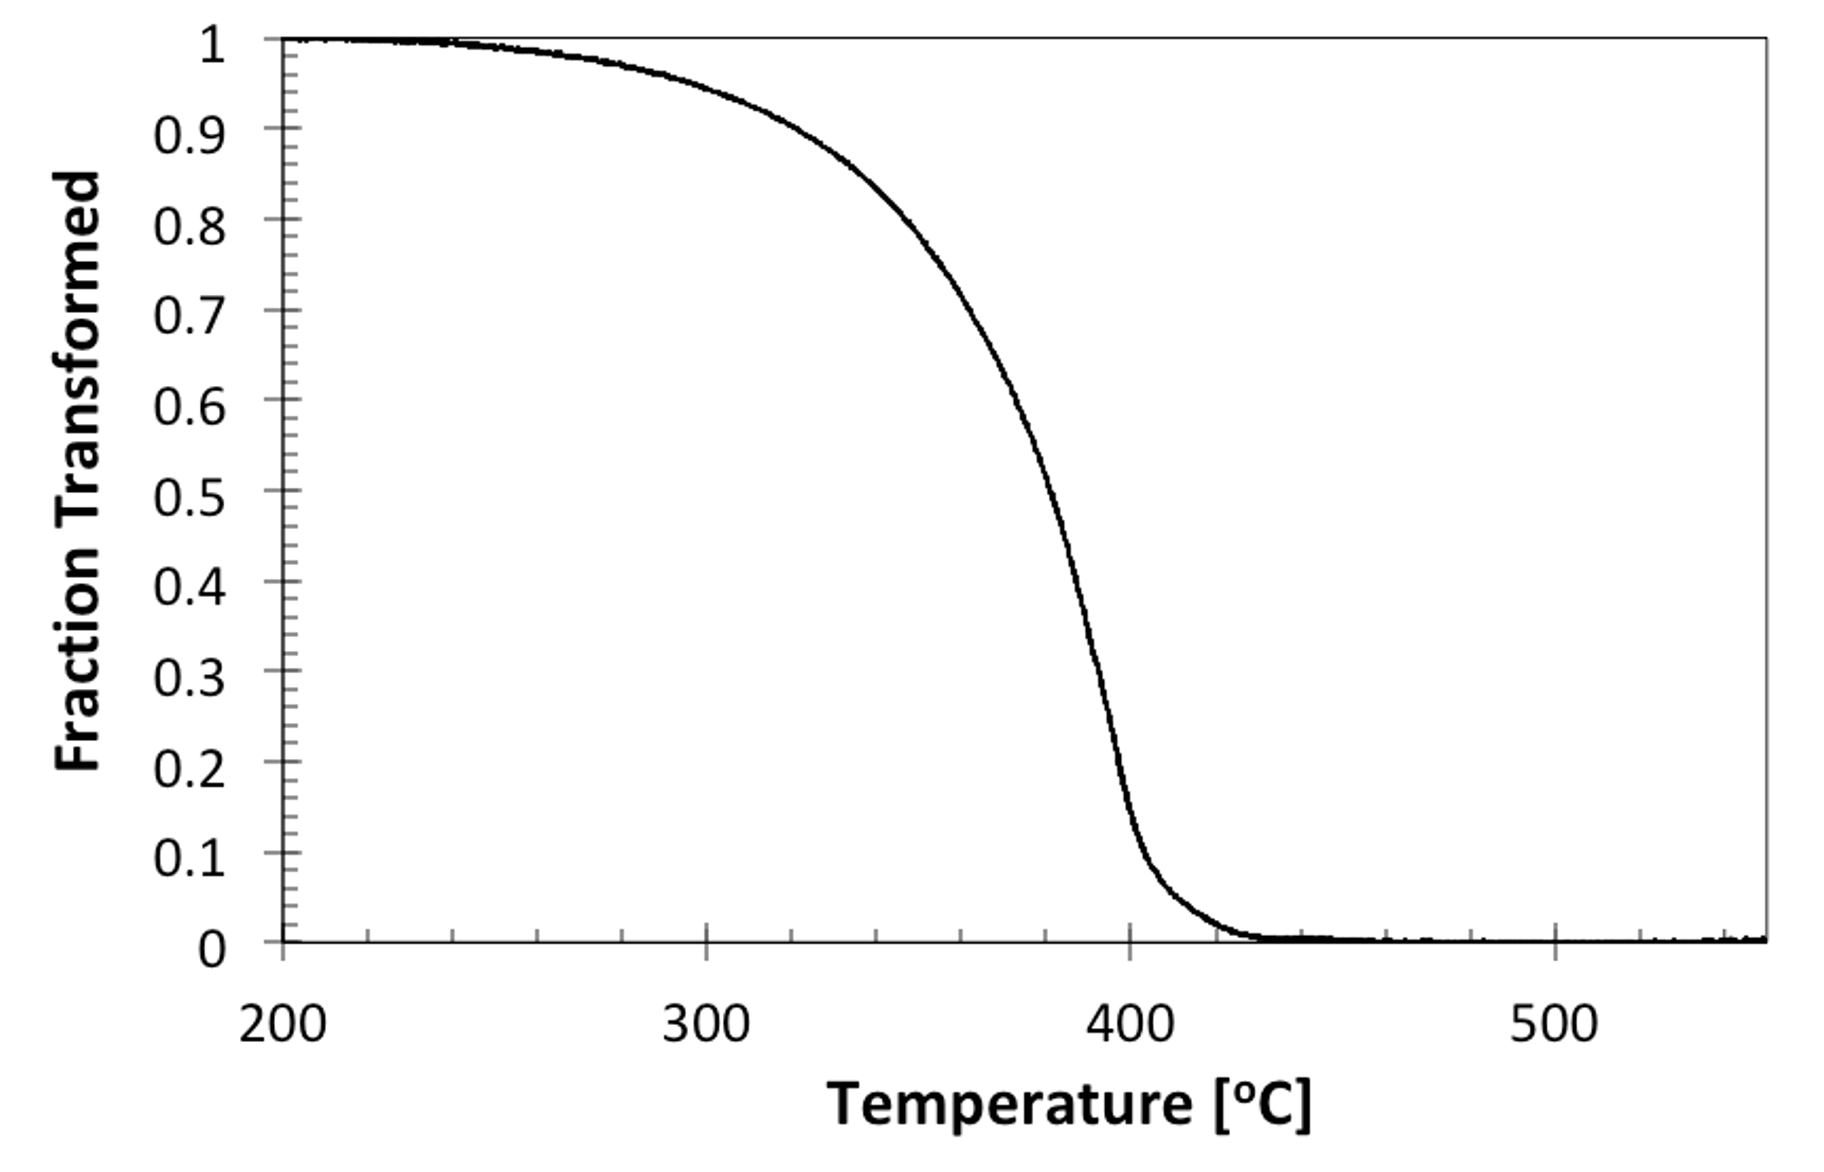 Figure 10. The evolution of the transformation on cooling depicted in Fig. 9.
Important note: this assumes that the final strain measured during the test corresponds to 100% transformed. If retained austenite is present, then this will need to be measured through a different technique (e.g., XRD) and accounted for. Also, errors may be introduced if a transformation involves significant carbon portioning into the retained austenite (e.g., if allotriomorphic ferrite forms at higher temperatures). This is because this carbon partitioning leads to an expansion of the austenite lattice parameter, and the accompanying increased strain is misinterpreted as being due to the volume fraction of ferrite increasing (not due to austenite expansion). Further details can be found in [2].
For curves with more than one transformation event, the volume fraction curve can be used to estimate the volume fractions of the respective microconstituents. For example, the volume fraction curve for Fig. 8, which shows both ferrite and bainite formation, is as follows:
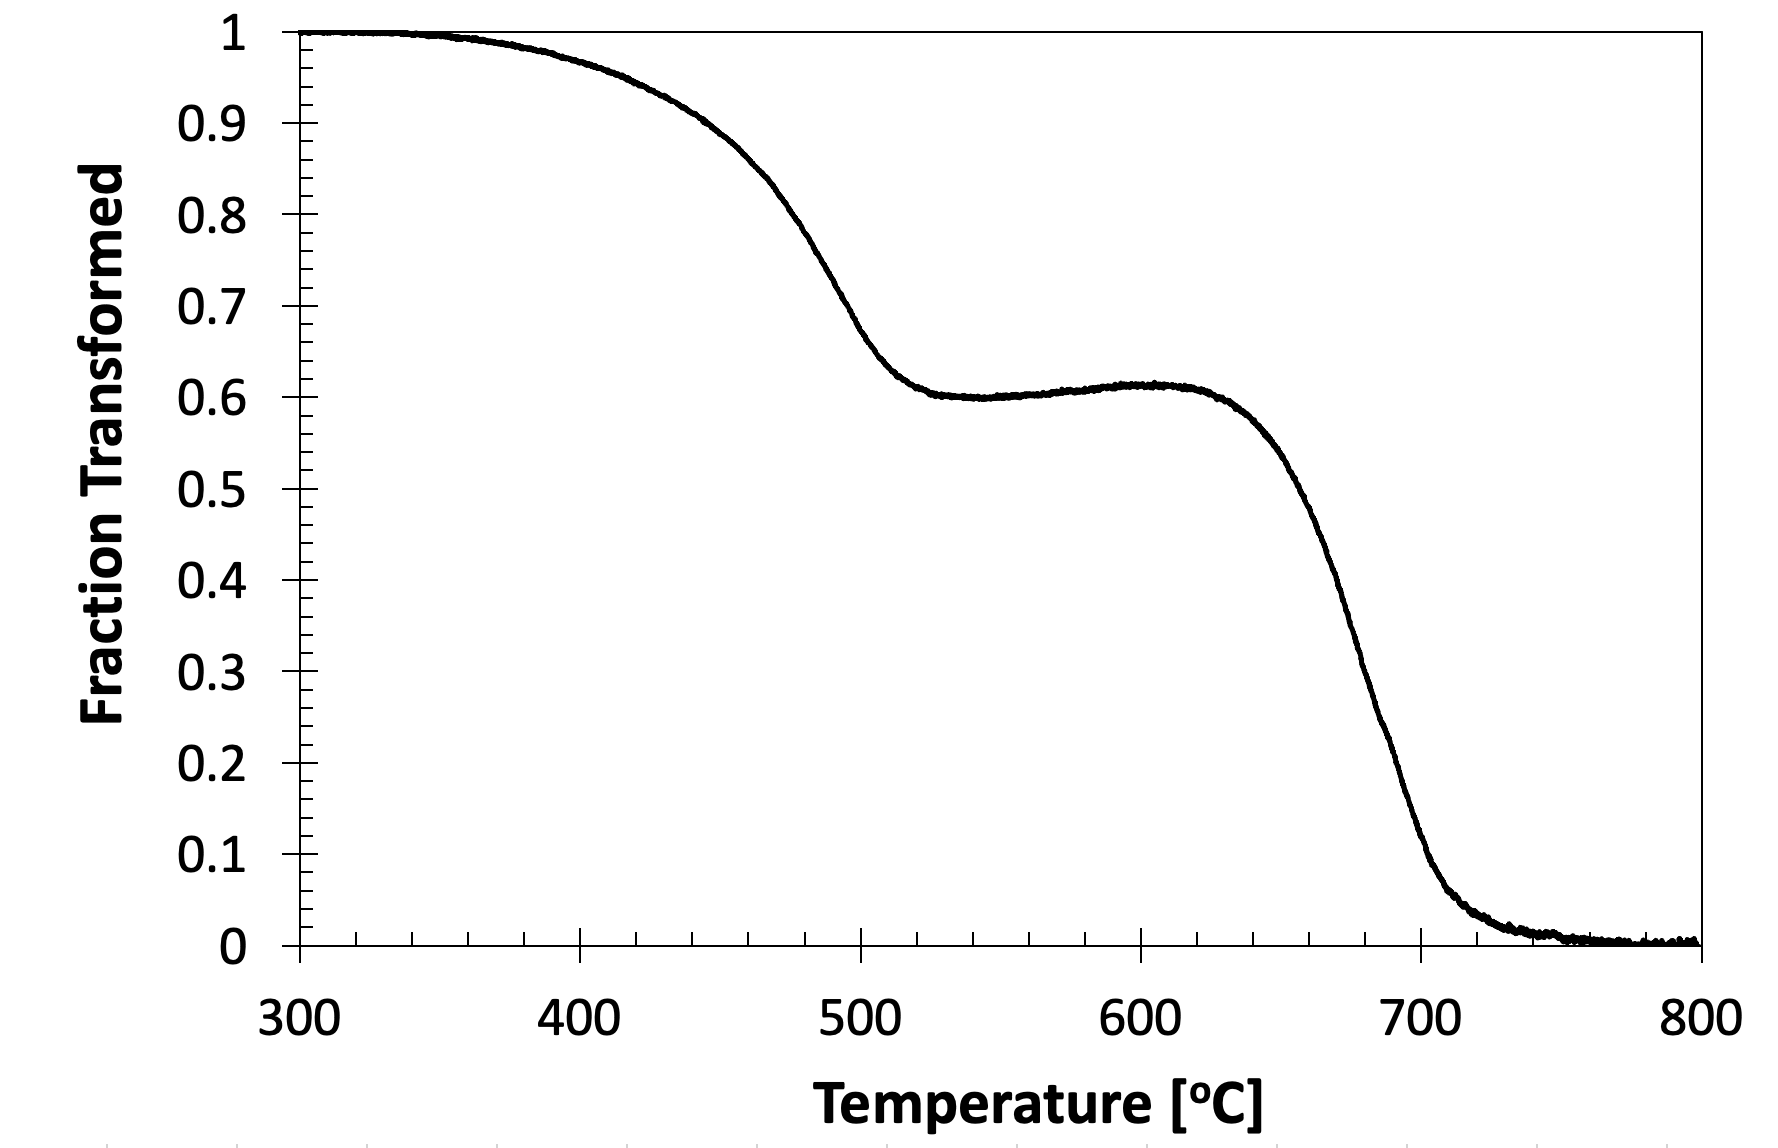 Figure 11. The evolution of the transformation on cooling depicted in Fig. 8.
There is no standard routine for reading the % of microconstituents formed in mixed samples. There are a number of different approaches, including quoting the volume fraction at a specified temperature (that is deemed to be between the finish T of one transformation and the start of the next). Another common approach is to take the volume fraction as that at the transformation start temperature of the subsequent reaction.
Note that no technique can be used to calculate the fractions of microconstituents that form simultaneously during a dilatometry experiment – their dilatations will be convoluted.
A question that must be asked when performing the analysis is ‘what am I measuring the fraction of?’. The answer to this should be informed by comparison of the start temperatures to previous studies or empirical relationships, and should also use the results of microscopy and hardness. This is discussed further in Section 6.2.
6. Common Artefacts and Misinterpretations
Common features and artefacts seen in dilatometry curves include the following, which can either be seen in Fig. 1 or are schematised in Fig. 12:
- The final length of the sample does not match the original length of the sample. This can be seen in Fig.1. The reasons behind this are not always clear, but can be a combination of:
- Different end microstructure to start microstructure, which can include the formation of retained austenite (more retained austenite will result in bigger difference, if the starting microstructure was 100% ferrite and cementite).
- Transformation plasticity could in theory contribute to this behaviour. The formation of hard martensite inside austenite can plastically deform it and will constrain any subsequent transformation, leading to macroscopic changes in length.
- ‘Drift’ in the apparatus. This is essentially referring to any change that is due to expansion or contraction of the machine, or change in the measuring system, that leads to a change in measured sample length. This seems to be especially prevalent at high heating and cooling rates when using alumina pushrods.
- Length changes during isothermal holding…
- Length changes during isothermal holding at high temperature. This can also be seen in Fig.1, in which there is a small drop in strain observed during holding at 1000˚C. The following can contribute:
- Phase transformations such as precipitate dissolution, which were not completed during the heat step(s).
- Creep of the sample, owing to the relaxation of residual stresses (the force applied to hold the sample in the pushrods is typically very small, and should not lead to creep). The removal of dislocations and other defects could in theory also contribute to the creep strain.
- ‘Drift’ in the apparatus, as described above.
- ‘Blips’ in the length change data in linear regions can arise from a number of sources:
- Sudden changes in gas flow rate*, owing to a switch from low to high flow rate valves (the machine will do this automatically). As mentioned earlier, these are particularly pronounced when the gas is switched on after performing the initial part of an experiment under a vacuum. If these are problematic, it is usually best to change the experimental process to avoid gas being introduced during the middle of the cooling step. Austenitisation (and other high-temperature holds) may still best be operated under vacuum to avoid decarburisation, as discussed in Section 4.1. However, this vacuum can be removed at the very start of any cooling step (away from transformation events) and a partial pressure introduced if necessary, to avoid sudden jumps in gas flow during subsequent cooling.
- Mechanical issues with the machine, such as untightened pushrods or broken or slipping pushrods. This can be caused by repeatedly using silica pushrods at temperatures up to or exceeding 1200 °C.
- Vibrations from the surroundings, although these would have to be significant (simply knocking the machine has no effect).
- ‘Spiralling’ is often observed during fast heating and cooling rates, particularly at high temperatures. It is usually caused by the machine struggling to maintain the correct (set) temperature, and rapidly changing the heating power and/or cooling gas flow rate. This can create a disparity between the sample temperature at the centre and the sample temperature at the surface thermocouple, and the dilatation read corresponds to neither. Not placing the sample correctly in the induction coil can cause this.
- Non-linear gradients (in regions usually linear) at fast cooling rates are often observed. These can arise owing to the non-uniform temperature through the volumes of samples when they are cooled rapidly using quenching gas at the sample surface. Lag in the measurement system could also cause this change, in theory, as could the effect of fast gas impingement on the pushrods.
- Apparent reversal of transformations can be seen in tests. There are few metallurgical phenomena that could explain this effect (one being the release of latent heat in one area of the sample retransforming another area). Instead, the origin is likely to be an issue with the measurement system itself, or perhaps some sort of creep or transformation plasticity. Indeed, it has been shown that application of a stress during the transformation can result in similar strain profiles, see [3].
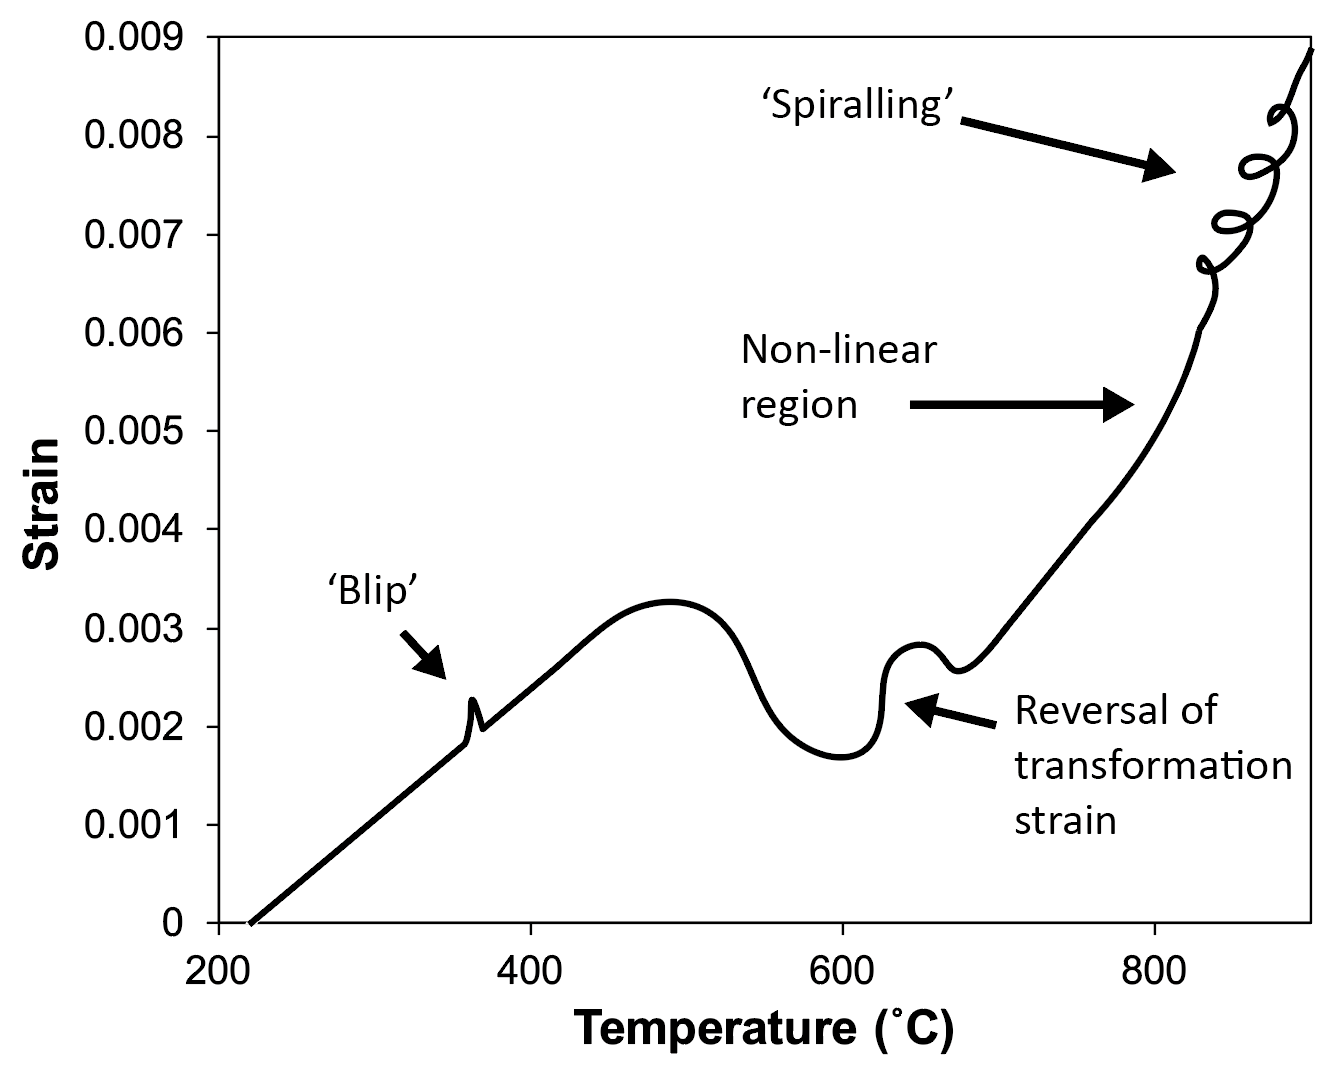 Figure 12. Schematising the artefacts that are commonly seen in dilatometry data.
- Decarburisation can occur during some heat treatments, see Fig. 13. As discussed in Section 4.1., it’s been found that this can happen when samples are held at high temperatures for a long duration (hours) with an inert gas atmosphere (presumably this is because oxygen contamination in the gas reacts with C at the sample surface). Holding under vacuum does eliminate the decarburisation, although at very high temperatures could lead to more sublimation of elements from the sample surface. Tests should be performed to find the best approach.
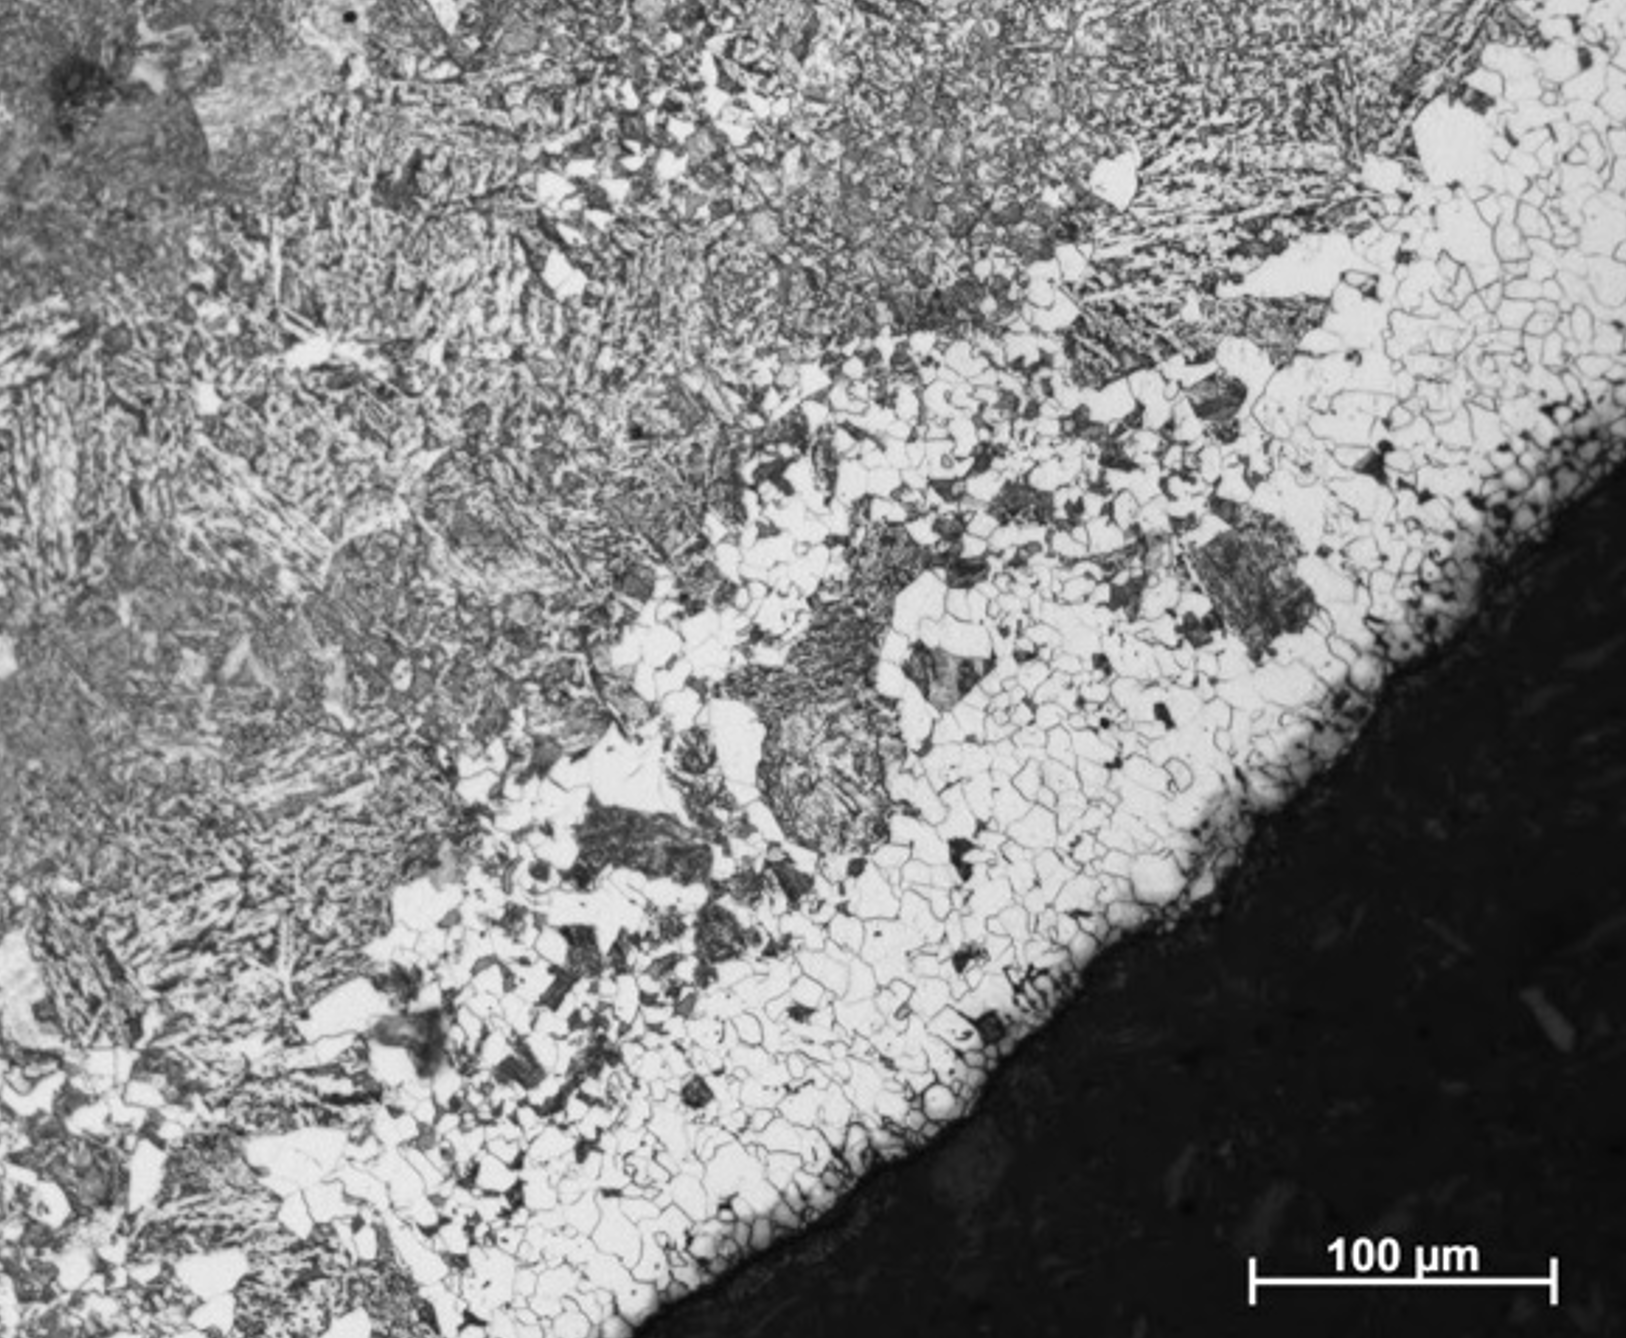 Figure 13. The decarburised surface layer of a low-alloy steel following a 2-hour hold at 820˚C with a partial pressure of helium.
7. Ensuring the Quality of Data and Interpretation
How can we assess the origins of artefacts in data? And how can we ensure our data is of good quality, and our interpretations are correct? The following approaches are tools that can be used.
In order to determine the origins of artefacts (and remove them if possible):
-
Different sample geometries and multiple thermocouple placements can be used to test whether non-uniform temperatures (or other geometry-related effects) are the cause of a phenomenon or not. For instance, non-linear gradients during fast cooling may disappear if hollow samples are used, since there will be more temperature uniformity.
-
Alternative sample materials are also useful when looking for the cause of artefacts. For example, a platinum reference (often supplied with the machine), or the use of austenitic steels (which should not transform) can be used to test for the origin of non-linear responses. Pure Fe can be used to test start temperatures. Samples that should creep less (e.g., W or intermetallics) can be used to assess the origins of ‘drift’.
-
Other machine-derived artefacts (such as ‘blips’ due to change in gas flow rate) can be assessed by examining the metadata gathered from the results files, such as the data associated with HF power or gas inlet flow rate.
-
Repeat measurements, either on the same sample or on samples of the same material, are always useful to determine whether artefacts have originated from one-time sample or machine oddities.
In addition to the removal/recognition of artefacts, to ensure good data quality and that our interpretations are sound:
-
Repeat measurements on different samples of the same material should be carried out if the uncertainty in results is to be adequately quantified. It may also be appropriate to examine samples taken from different locations in a forging and/or at different orientations to a particular direction (e.g., the radial direction).
-
Comparisons of results to those obtained through other experimental methods, in particular optical and scanning electron microscopy (SEM), and hardness, should always be carried out. Such comparisons are critically important when confirming the presence of microconstituents and their volume fractions. Optical microscopy is particularly useful to checking volume fractions of ferrite, whilst the presence of martensite will usually be obvious from the material hardness. Ball-park figures for the hardnesses of single and mixed microconstituent microstructures can be predicted using the relationships provided by Ion et al. [4].
-
Comparisons to empirical relationships for start temperatures can provide reassurances with respect to the identity of a start temperature (e.g., whether it corresponds to the bainite start or martensite start). Such relationships are typically functions of alloy composition. See Appendix 2 for a list of these.
-
Comparisons to results from more advanced models for phase transformation kinetics can also be a useful way validate the interpretation of transformation curves. Good examples of such models included the MUCG83 programme developed at University of Cambridge [5] and the transformation model developed by Li et al. [6] (note, however, that many such models use the same empirical expressions for start temperatures shown in Appendix 2).
8. Complementary and Alternative Techniques
As stated in the previous section, optical microscopy and SEM, as well as hardness, are primary experimental techniques that are complementary to quenching dilatometry, in that they are able to help confirm the microconstituents present in a sample. Transmission electron microscopy is also of use, although is a specialist technique that only assesses a small volume of material and requires expert interpretation. Similarly, techniques like X-ray diffraction (XRD), electron back-scatter diffraction and magnetic measurements can also be useful to determine whether any retained austenite is present in a sample.
In terms of measuring the real-time evolution of phase transformation behaviour, in-situ experiments can be performed. It is possible to perform in-situ heating and cooling experiments in both the SEM and TEM, but observations are often complicated by sample drift, surface effects and oxidation. A realistic alternative is the use of real-time X-ray diffraction using a synchrotron source of X-rays (so-called synchrotron XRD, SXRD). Such sources are able to provide very high fluxes of X-rays, meaning that signals can be transmitted through large volumes of material (a few mm in thickness) and be detected with high-frequency acquisition systems. By quantifying the evolution of austenite/ferrite during heating/cooling cycles, SXRD provides comparable information to quenching dilatometry (volume fraction transformed, start temperatures), see [2]. However, SXRD requires access to national experimental facilities (synchrotron sources) and analysis of results is not trivial.
9. ‘How To’ Guide
9.1. Continuous Cooling Transformation (CCT) Diagrams
The production of CCT diagrams is one of the principal uses of dilatometry, and is of particular interest to metallurgists who wish to understand and/or predict microstructural evolution when forgings are quenched during standard austenitisation-quench-temper heat treatments.
The following are notes on conducting experiments to produce CCT diagrams:
- Heating and cooling rates, as well as the hold times and temperatures used, should be as close to the manufacturing process as possible. The heating rate and hold time and temperature are important as they will set the prior austenite grain size, which will determine the transformation kinetics.
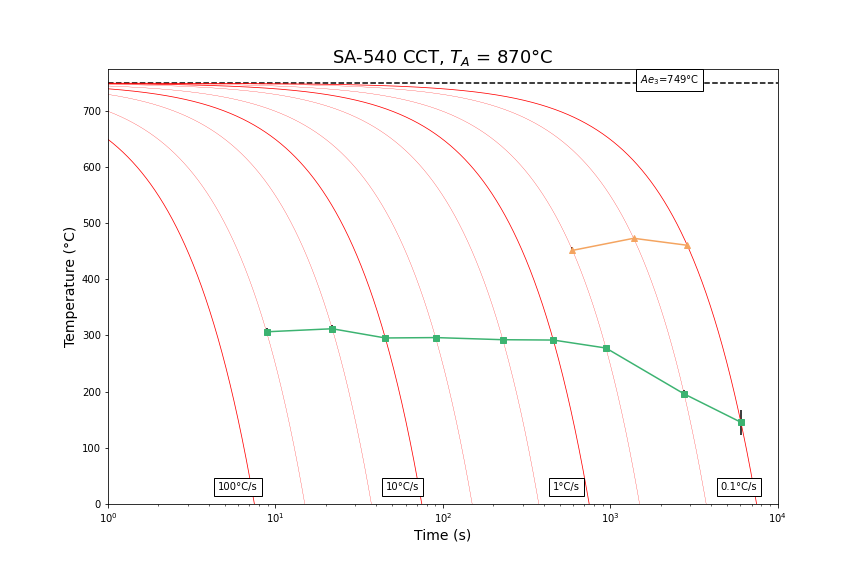
- Typical cooling rates to assess are: 0.1, 0.2, 0.5, 1, 2, 5, 10, 20, 50, 100˚C s-1.
- Transformation start temperatures should be determined as outlined in Section 5.
- The CCT diagram should be plotted such that time = 0 when the Ae3 temperature is passed through.
- An alloy’s Ae3 temperature can be determined using Thermo-Calc software (https://thermocalc.com/) or can be manually calculated using published empirical equations.
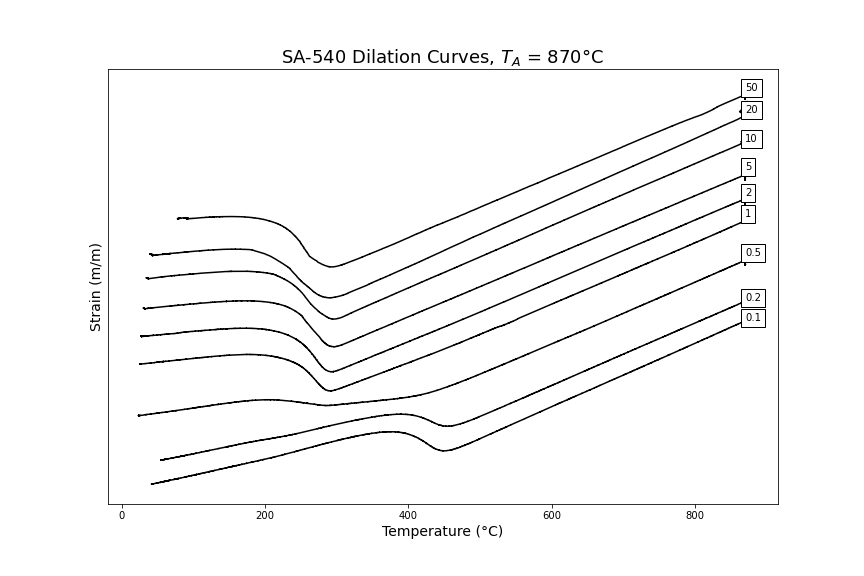
Example equations for manually calculating steel Ae3 temperatures are provided in Appendix 2. Appendix 3 provides examples of dilatation curves obtained for a number of different cooling rates in SA540 B24 steel.
The prior austenite grain size should be measured and quoted alongside any CCT diagram. It can be measured using thermal etching.
9.2. Thermal Etching in the Dilatometer
Measuring the prior-austenite grain size in modern low-alloy steels is challenging. Etches (such as picric acid) which may have been used historically to reveal boundaries are not very effective in modern low-alloy steels that contain little phosphorus. Instead, two other methods can be used: EBSD and thermal etching. Like etching, both require the formation of bainitic or martensitic structures from the prior austenite, because this means that the grain boundaries are preserved after cooling.
Using EBSD, the orientations of martensitic or bainitic plates can be mapped, and then grain construction software used to reconstruct the prior austenite grain structure. The reconstruction is possible because only certain crystallographic variants of martensite or bainite should exist in a single prior austenite grain. An example of reconstruction software is the MTEX toolbox [7]. There are challenges associated with this process in that as-quenched microstructures are often difficult to analyse using EBSD, since they tend to be highly strained and full of defects. Tempering is needed to anneal defects, but this should not be so severe as to change the grain structure.
Thermal etching measures prior austenite grain size more directly, and can be performed in a quenching dilatometer. It works by subjecting a polished surface to the austenitisation heat treatment in a vacuum. When this happens, the surface of the sample grooves at grain boundaries owing to surface energy considerations. These grooves then appear dark when viewed optically, Fig. 14. The process for conducting thermal etching in a quenching dilatometer is as follows:
- A standard solid 4 mm diameter x 10 mm long sample should be ground on the curved edge to produce a flat region along the length of the sample (the result is a cylinder with a section of its curved edge sliced off uniformly along its length).
- This flat region should be polished to as good a finish as possible.
• The sample should be heat treated in the dilatometer under vacuum following the austenitisation process of interest. The chamber may need to be vacuum pumped, flooded with an inert gas and re-pumped a few times to ensure that most of the oxygen has been removed from the chamber. It can also help to clean the inside of the induction coil with a cloth and some ethanol before starting the experiment. - The sample should be cooled in vacuum by setting the dilatometer to cool rapidly, but without turning on the quenching gas (this can result in surface oxidation).
- Images of the surface can be taken using an optical microscope, and the linear intercept method used to calculate the grain size.
- The technique is not suitable for steels with low hardenability, which don’t form martensite or bainite when cooled in vacuum.
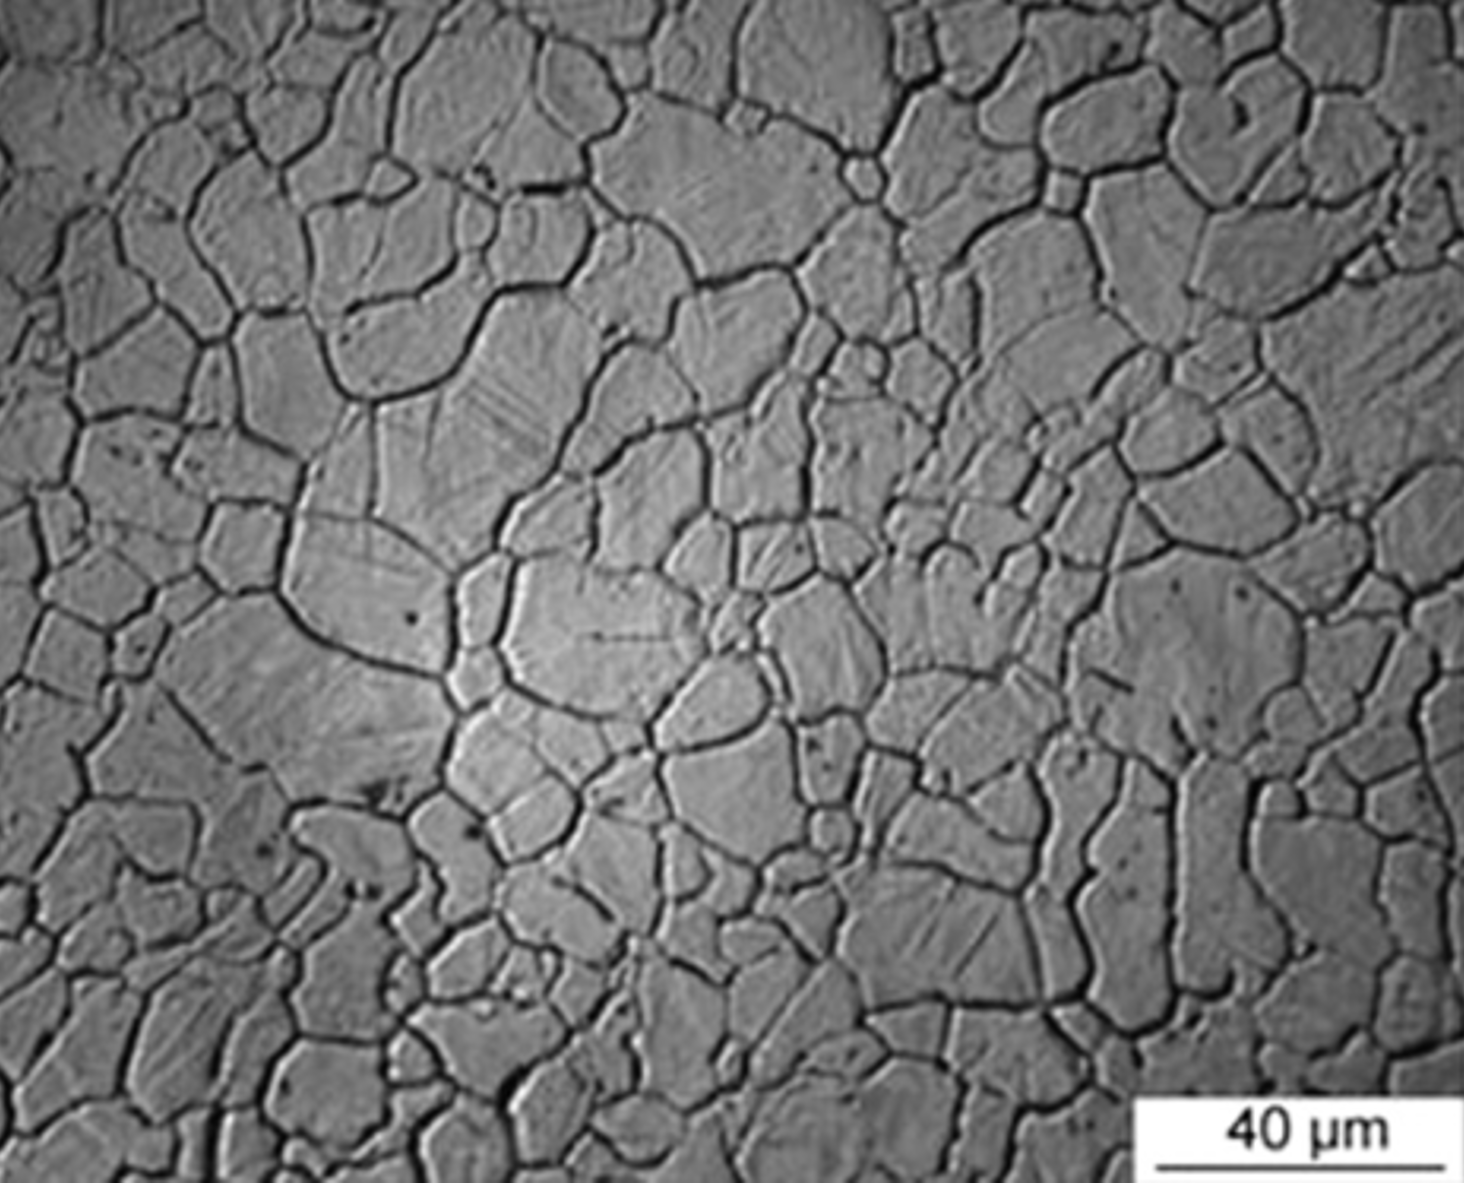 Figure 14. The results of thermal etching, as viewed using optical microscopy. Taken from [8].
Acknowledgements
This work was instructed and funded by Rolls-Royce plc. Special thanks to E. Grieveson and D. Cogswell for their guidance during the writing of this document.
References
[1]. H-S. Yang and H.K.D.H. Bhadeshia, Uncertainties In Dilatometric Determination Of
Martensite Start Temperature, Materials Science and Technology 23 (2007) 556-560.
[2]. E.J. Pickering, J. Collins, A. Stark, L.D. Connor, A.A. Kiely, H.J. Stone, In Situ Observations of Continuous Cooling Transformations in Low Alloy Steels, Materials Characterization 165 (2020) 110355.
[3]. J.-B. Leblond, G. Mottet, J. Devaux and J.-C. Devaux, Mathematical Models of Anisothermal Phase Transformations in Steels, and Predicted Plastic Behaviour, Materials Science and Technology 1 (1985) 815-822.
[4]. J.C. Ion, K.E. Easterling and M.F. Ashby, A Second Report On Diagrams Of Microstructure And Hardness For Heat-Affected Zones In Welds, Acta Metallurgica 32 (1984) 1949-1962.
[5]. M.J. Peet and H.K.D.H. Bhadeshia, MUCG83 freeware, http://www.msm.cam.ac.uk/map/steel/programs/mucg83.html
[6]. M.V. Li, D.V. Niebuhr, L.L. Meekisho and D.G. Atteridge, A Computational Model for the Prediction of Steel Hardenability, Metallurgical and Materials Transactions B, 29B (1998) 661-672.
[7]. MTEX analysis toolbox for MATLAB, https://mtex-toolbox.github.io/
[8]. H. Pous Romero, I. Lonardelli, D. Cogswell and H.K.D.H. Bhadeshia, Austenite Grain Growth in a Nuclear Pressure Vessel Steel, Materials Science and Engineering A 567 (2013) 72-79.
APPENDIX 1 – Sample Geometries
The following are examples of sample geometries used for pushrod dilatometers (provided by TA Instruments):
APPENDIX 2 – Transformation Start Temperatures & Ae3 Calculations
Empirical relationships for bainite and martensite start temperatures are listed below:
| Expression (all compositions in wt.%) | Reference | Value for SA508 Grade 3 | Value for SA508 Grade 4N | Value for SA540 |
|---|---|---|---|---|
| Ms (˚C) = 561–474C – 33Mn – 17Cr – 17Ni – 21Mo + 10Co – 7.5Si * | W. Steven and A.G. Haynes, JISI 183 (1956) 349–359. | 406˚C (404˚C) | 342˚C (341˚C) | 287˚C (285˚C) |
| Ms (˚C) = 539 – 423C – 30.4Mn – 12.1Cr – 17.7Ni – 7.5Mo + 10Co – 7.5Si * | K.W. Andrews, JISI 203 (1965) 721–727. | 407˚C (402˚C) | 348˚C (344˚C) | 298˚C (293˚C) |
| Bs (˚C) = 637 – 58C – 35Mn – 15Ni – 34Cr – 41Mo | M.V. Li, D.V. Niebuhr, L.L. Meekisho and D.G. Atteridge, Metall. Mater. Trans. B, 29B (1998) 661-672. | 542˚C | 470˚C | 519˚C |
*The modification in bold was proposed by Kung and Rayment (C.Y. Kung and J.J. Rayment, Metall. Trans. A 13 (1982) 328–331).
Examples of 3 different empirical equations for predicting Ae3 temperatures are listed below:
| Expression (all compositions in wt.%) | Reference | Value for SA508 Grade 3 | Value for SA508 Grade 4N | Value for SA540 B24 |
|---|---|---|---|---|
| Ae3 (˚C) = 910 - 203(C)^(1/2) + 44.7Si - 15.2Ni + 31.5Mo + 104V + 13.1W - 30.0Mn + 11.0Cr + 20.0Cu - 700P - 400Al - 120As - 400Ti | K.W. Andrews, JISI 203 (1965) 721–727. | 802˚C | 787˚C | 751˚C |
| Ae3 (˚F) = 1570 - 323C - 25Mn + 80Si - 3Cr - 32Ni Note: ˚C = (˚F - 32)(5/9) |
R.A. Grange, Metal Progress 73 (1961). | 801˚C | 744˚C | 748˚C |
| Ae3 (˚C) = 871 - 254.4(C)^(1/2) - 24.2Ni + 51.7Si | Eldis: REFERENCE NEEDED | 765˚C | 705˚C | 694˚C |
The alloy chemistries used to calculate the start temperatures and Ae3 values above are shown here (all wt.%). Only elements of interest are provided:
| Steel | C | Si | Mn | Ni | Cr | Mo | V | Cu | Al | Ti |
|---|---|---|---|---|---|---|---|---|---|---|
| SA508 Grade 3 | 0.18 | 0.25 | 1.32 | 0.74 | 0.21 | 0.49 | - | 0.03 | 0.002 | - |
| SA508 Grade 4N | 0.21 | 0.1 | 0.35 | 3.87 | 1.87 | 0.5 | - | 0.02 | 0.004 | - |
| SA540 B24 | 0.42 | 0.26 | 0.72 | 1.78 | 0.85 | 0.31 | 0.01 | 0.08 | 0.021 | 0.01 |
APPENDIX 3 – Examples of CCT Results
The following dilatometry curves and CCT diagram for SA-540 B24 were found for an austenitisation heat treatment of 870˚C for 2 hours (to simulate a typical industrial treatment). The Ae3 temperature was calculated, using equations by Andrews and Grange, and determined to be 749˚C.
