Slicing maps and plotting texture variation
Slicing maps and plotting texture variation
Selecting a sub-region
An initial plot of the EBSD map can help to determine the x and y points which define the sub-region region. The inpolygon function is used to define the points that lie within the region.
x_top = 0
y_left = 0
x_bottom = 100
y_right = 100

x_width = x_bottom-x_top
y_width = y_right-y_left

region = [x_top, y_left, x_width, y_width];
condition = inpolygon(ebsd,region);
ebsd_cropped = ebsd(condition);
ori_cropped = ebsd_cropped('Ti-Hex').orientations
The orientations from the cropped map can then be used to plot pole figures, ODFs, etc.
The map can also be exported to ctf using:
ebsd_cropped.export(‘myFile.ctf’)
Slicing a map into strips
To slice a map into strips, the x,y positions need to be defined and iterated through, with the maps sequentially saved.
An example script used to do this is given below;
num_strips = 10; % number of strips to cut the map into (resolution)

% define the size of the EBSD map
ebsd_grid = ebsd.gridify;
ebsd_shape = size(ebsd_grid.id);
original_y = ebsd_shape(1);
original_x = ebsd_shape(2);
stepSize = ebsd_grid.dx;

x_min = (sqrt(x_origin * x_origin)/stepSize);
x_max = original_x + (sqrt(x_origin * x_origin)/stepSize);
x_length = x_max - x_min;

y_min = (sqrt(y_origin * y_origin)/stepSize);
y_max = original_y + (sqrt(y_origin * y_origin)/stepSize);
y_length = y_max - y_min;

% used if splitting into strips along y
y_width = floor(y_length / num_strips); % round to nearest integer
y_axis = (1:num_strips);

% used if splitting into strips along x
x_width = floor(x_length / num_strips); % round to nearest integer
x_axis = (1:num_strips);

cutmap = containers.Map('KeyType', 'int32', 'ValueType', 'any'); % creates an empty Map object

for strip_index = 0:num_strips-1
    % separate the map section

    % set out the coordinates for the edge of the region
    % note, region is defined as x,y origin and an x,y width which is added onto the origin

    % if splitting into strips along y (breaking up y)
    % y_min_strip = strip_index * y_width;
    % region = [x_min*stepSize, y_min_strip*stepSize, x_length*stepSize, y_width*stepSize];

    % if splitting into strips along y (breaking up y) and x is negative
    % y_min_strip = strip_index * y_width;
    % region = [-x_min*stepSize, y_min_strip*stepSize, -x_length*stepSize, y_width*stepSize];

    % if splitting into strips along x (breaking up x)
    % x_min_strip = strip_index * x_width;
    % region = [x_min_strip*stepSize, y_min*stepSize, x_width*stepSize, y_length*stepSize];

    % if splitting into strips along x (breaking up x) and x is negative
    x_min_strip = strip_index * x_width + x_min;
    region = [-x_min_strip*stepSize, y_min*stepSize, -x_width*stepSize, y_length*stepSize];

    % Cut the EBSD map
    condition = inpolygon(ebsd,region); % points located within region
    ebsd_strip = ebsd(condition); % create ebsd map for region
    cutmap(strip_index) = ebsd_strip; % store strip in Map object with index
    ebsd_cutmap = cutmap(strip_index); % read out ebsd_cutmap from the Map object

    % plot the IPF map to check the slices
    outputFileName = strcat(analysis_path,sample_name,'_IPF_map_strip_',num2str(strip_index))
    IPF_map_plot(phase, ebsd_cutmap, outputFileName, visible)

end
Example code
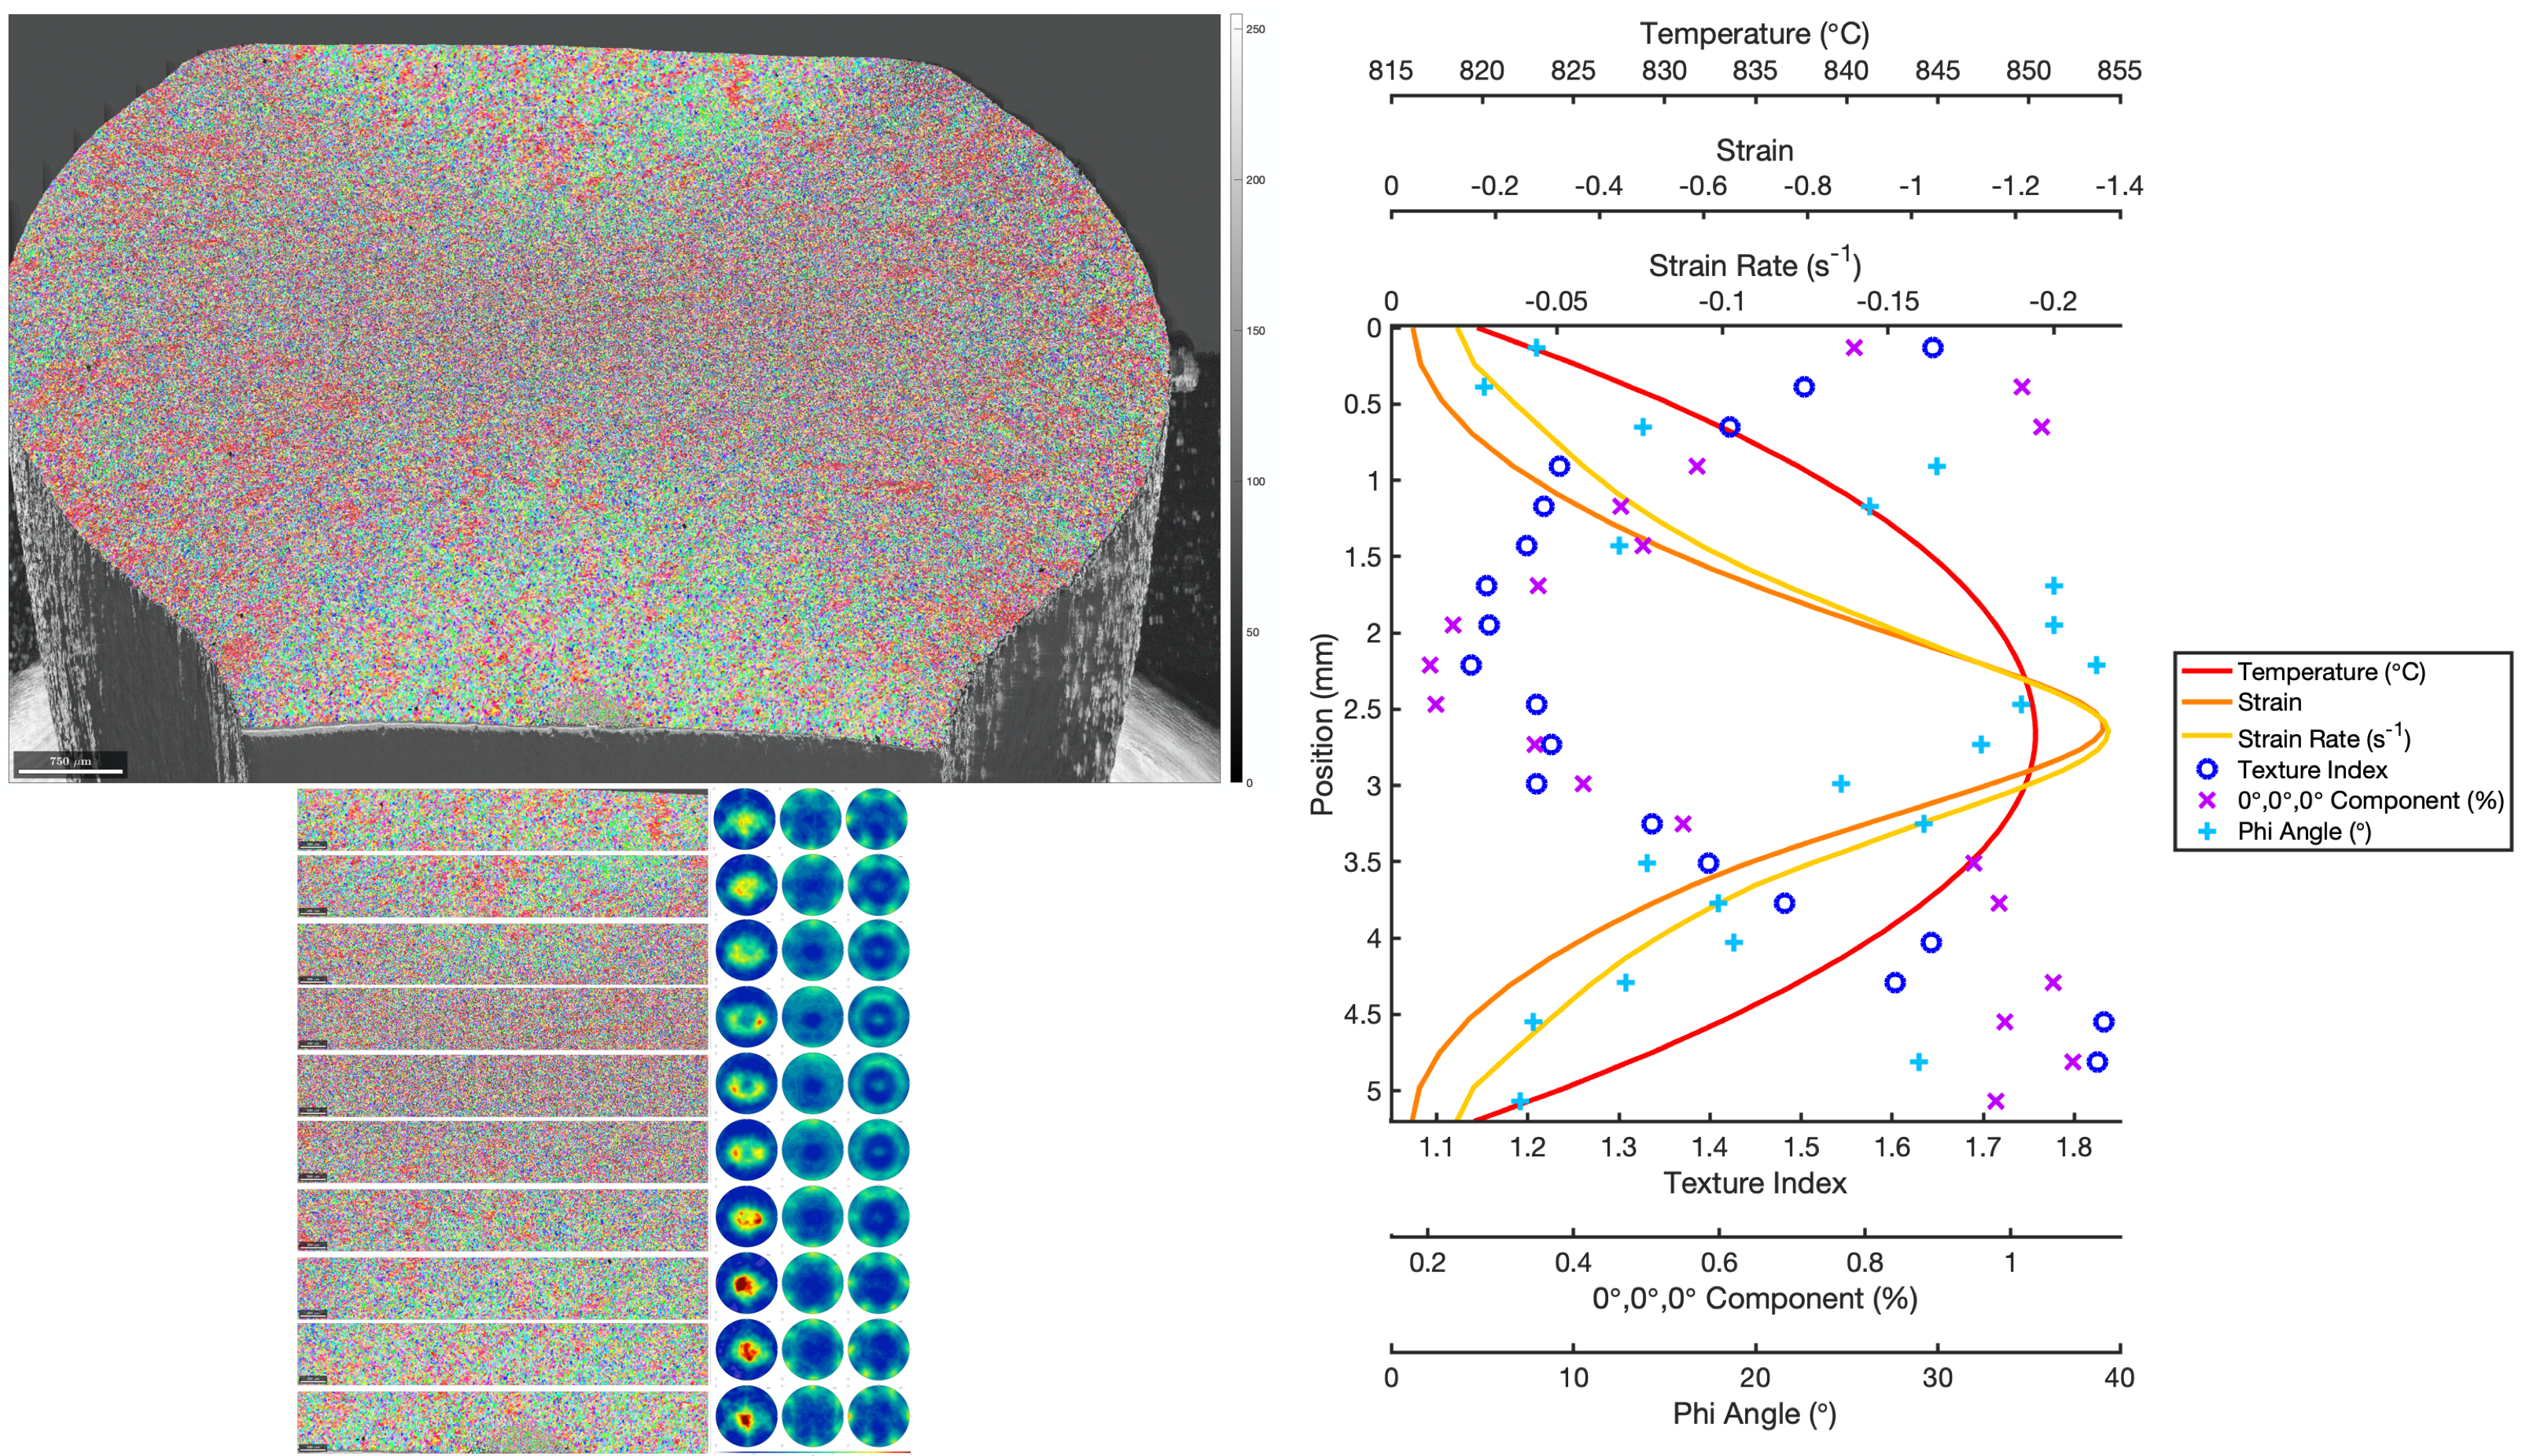
An example analysis for slicing EBSD maps into strips and plotting the texture variation is available here on GitHub
This example shows the texture variation across a Ti compression sample, outputting maps, pole figures and ODFs for the different strips, as well as plotting the variation of different texture strength values (as shown in the figure below). The code allows the user to choose any number of strips and select the orientation of those strips. This code includes fixes for any negative x or y values that might result due to rotation of the data.

