Automated Optical Microscopy with ZEN 2
ZEISS Axio Imager 2 microscope combined with ZEN 2 image-processing and analysis software for digital microscopy (D 010)
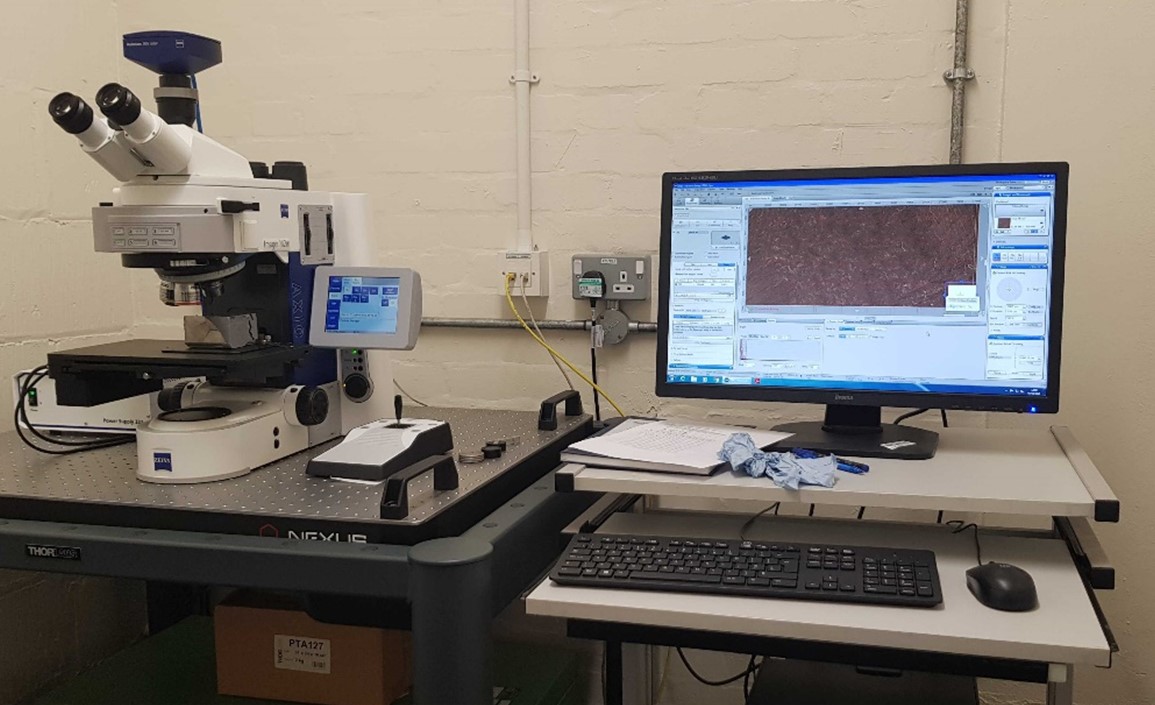
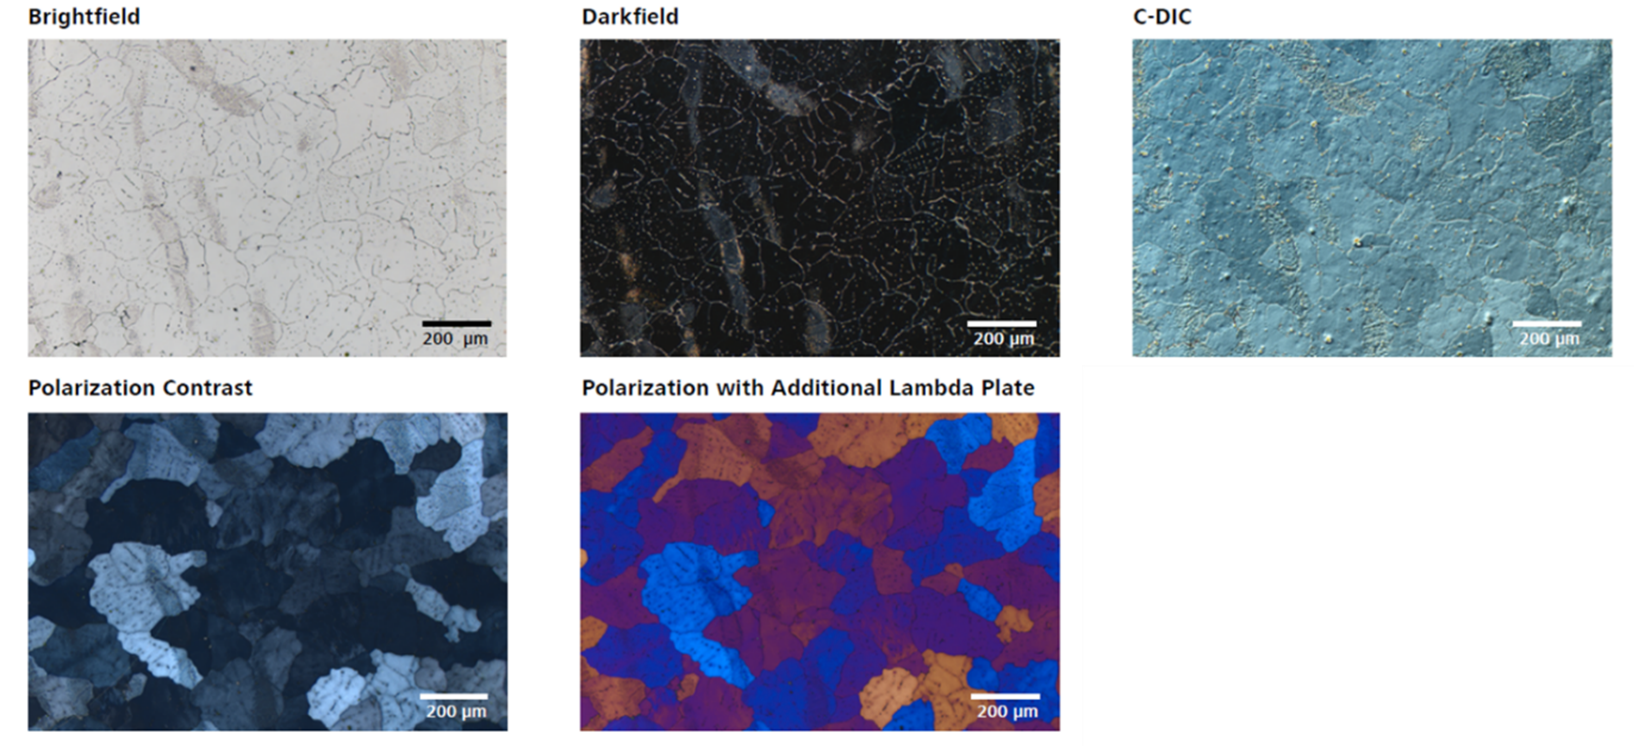
ZEISS Axio Imager 2 microscope offers couple of contrasting techniques for reflected light mode, which is used for imaging metal specimens: Brightfield, Darkfield, Circular Differential Interference Contrast (C-DIC), Polarization Contrast and Polarization with Additional Lambda Plate. Illustrative images for all of them are shown below. For Ti and its alloys, the common way to reveal the microstructure is to prepare and etch the specimen in Kroll’s reagent and to use brightfield technique to look at it. However, microstructural details in Ti alloys can also be seen using polarized light, without etching. This is possible when the surfaces contain structures that alter the state of polarization during the reflection process, which is the case for hexagonal α Ti, where individual grains in a polycrystalline sample reflect different light intensities depending on their orientation. Most often polarization contrast is used for this purpose. Although, the C-DIC technique uses polarized light too, by using the Nomarksy prism it reveals small differences on the surface of the specimen and therefore focuses more on the topography of the surface.
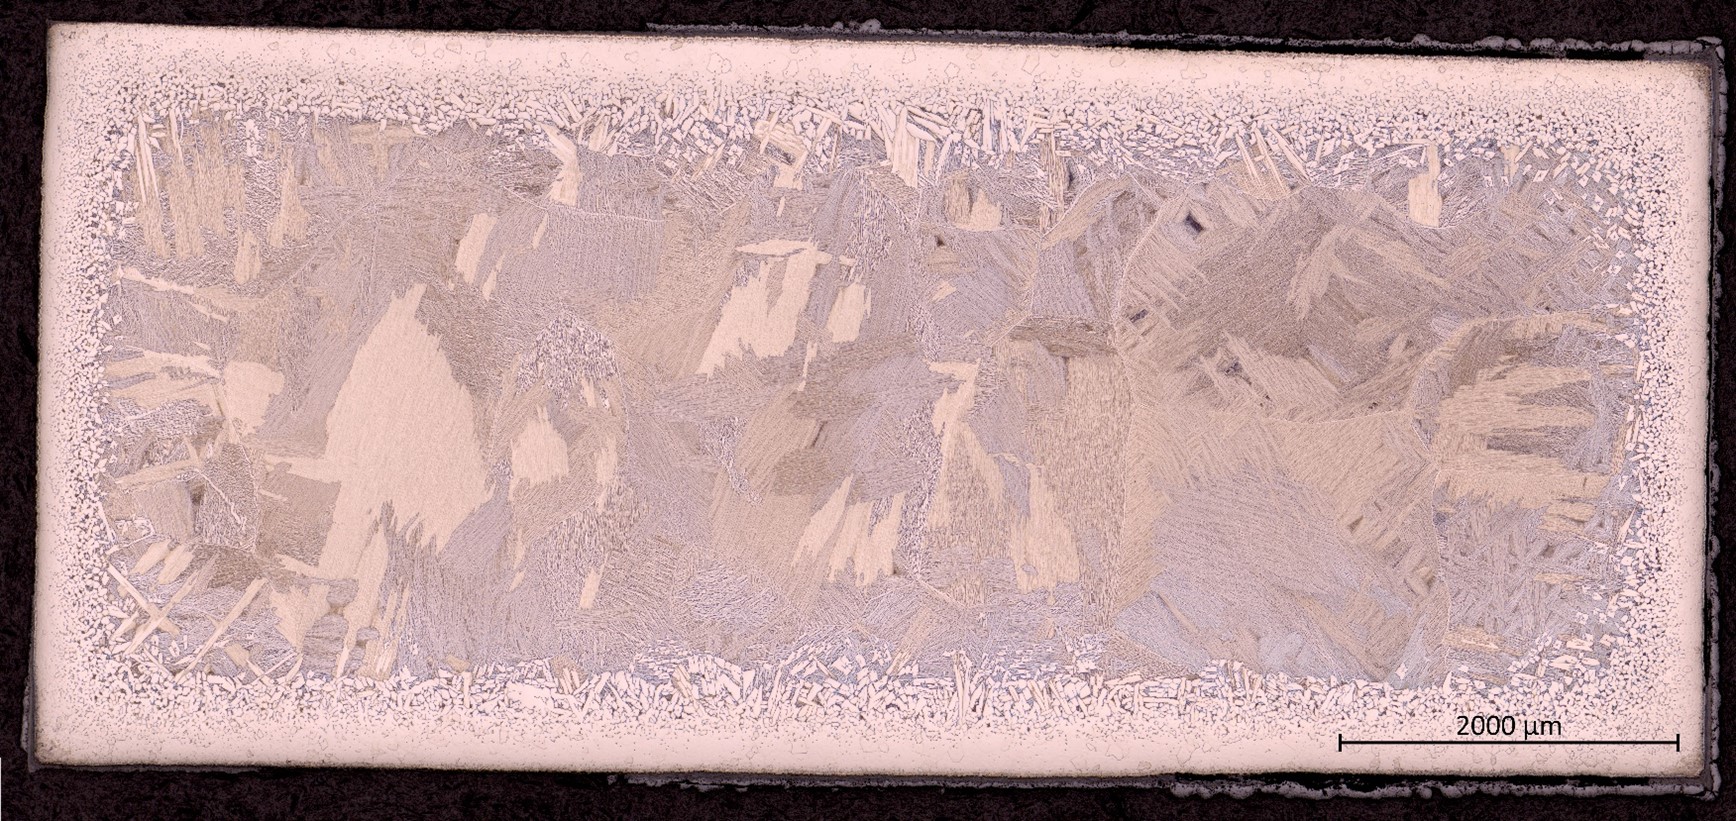
There are also other advantages of this microscope. The first is the motorized stage that enables to achieve reproducible illumination settings together with constant image quality. The second is the stage carrier that have been designed as a vibration-free unit, isolated from the rest of the stand, which creates good measurement conditions for adequate, multiple measurements. This unit is combined with ZEN 2 software, which is image-processing and analysis software for digital microscopy. In addition to basic functionality for image acquisition and elementary image processing, annotations, etc, it offers additional modules like Tiles module that acquire number of individual images and combine them together to create high-resolution map of the entire sample or a region of interest, using suitable focus strategy. In Lightform this is the main purpose of using this microscope, for individual imaging other microscopes need to be used. The example of the map acquired using the Tiles mode is shown below (Brightfield, RGB, 5X). This is Ti6Al4V specimen after specific heat treatment. The overview of the specimen with given magnification gives us the opportunity to look at the entire sample instead of at individual frames, zoom into chosen area without loosing the resolution (the limit is of course the magnification we acquired the map at) and look for microstructural features that are of interest. If particular region was interesting for us, we could do another map of this region with higher magnification, capturing finer properties of given microstructure.
Manual
Switch on the power supply and the microscope first.
Log into the PC and open up ZEN Pro (don’t place the specimen on the stage yet).
Click ‘calibrate now’ to calibrate the stage.
Before setting up the microscope, make sure that the surface of your specimen is flat by using the squeezing tool and some plasticine, which is very important step in acquiring stitched map of your specimen. Lower down the stage of the microscope and safely place the specimen on the stage. Choose the smallest magnification on the microscope’s screen and the contrasting technique you wish to use: Bright Field, Dark Field, C-DIC, Pol.
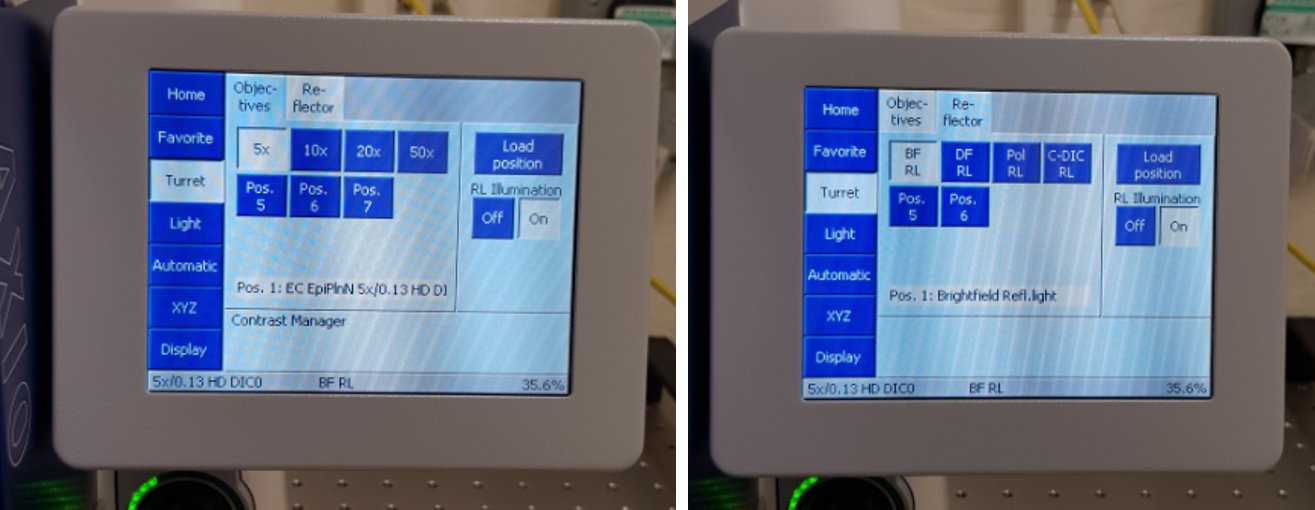
Focus on the surface of the sample carefully by looking through the eye piece.
In the interface of ZEN Pro you will see 4 main tabs:

Under the ‘Locate’ tab, click the life image to see your specimen. Adjust the intensity of the light to your sample on the microscope (knob under the display screen as shown above).
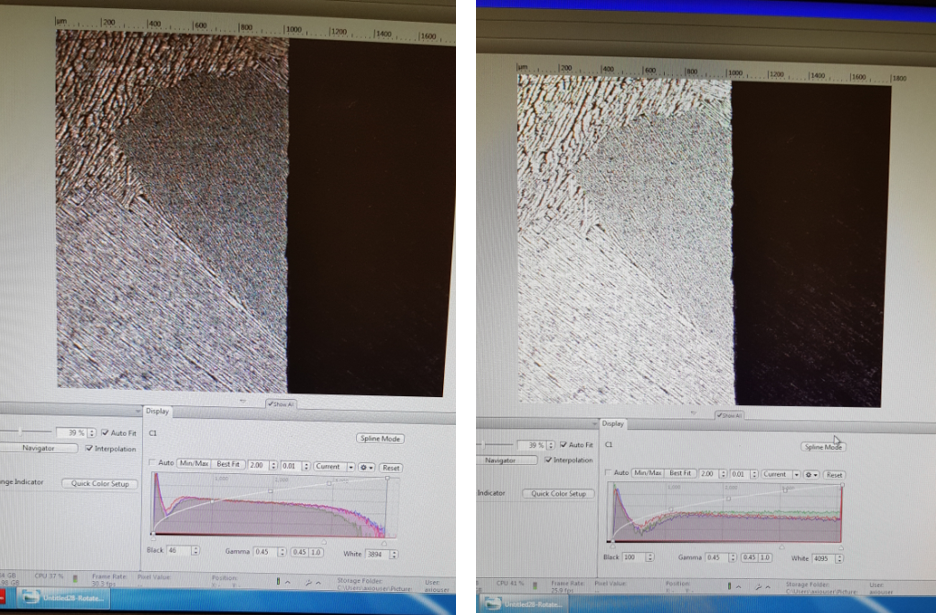
In locate tab you need to make sure that the microscope settings are suitable for your material. One of the important parameters you can adjust is the exposure time, it measures how long the camera will be exposed to the light (photons) reflected from your sample. The longer the exposure time, the more photons the detector will receive, resulting in increased pixel intensity and a “brighter” image. Ideally, when you acquire an image you want to use the longest possible exposure time, without saturating any of the pixels. On the histogram under ‘Display’ tab below the life image you want to use the entire dynamic range of your camera without saturating any pixels. Below you will find an example of well adjusted (left) and oversaturated (right) image together with the histogram below it.
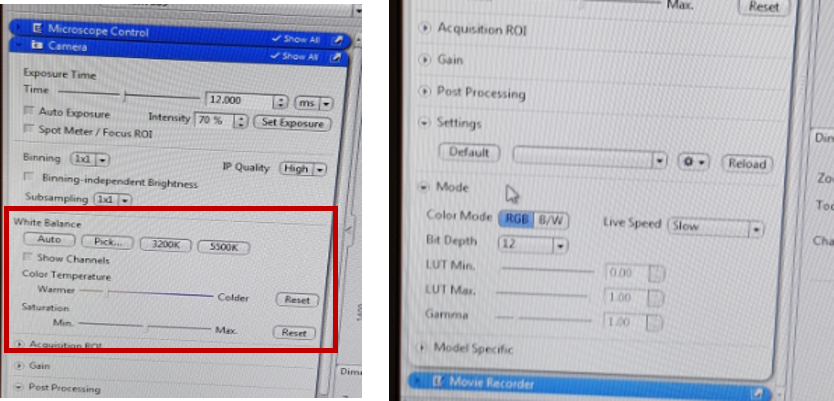
You can adjust the colour channels in the ‘Camera’ tab and chose the color mode (RGB – red green blue or BW – black white) in the ‘Mode’ tab.
Under the live image area, you can adjust the general view options on ‘Dimensions’, ‘Graphics’ and ‘Display’ tab. The ‘Display’ tab shows the settings for brightness and contrast. You can move the controls under the plot to left and right in order to adjust the values for Brightness and contrast. Anything below this value (small triangle – Black) will be shown as black and anything above that value (small traiangle – White) will be shown as white, and anything between will be contrast scaled, using the gamma value for the display contrast curve that you enter. The 0.45 of gamma value will set the optimum colour presentation. ‘Best Fit’ option should give you good results too.

When you are happy with the settings, move to ‘Acquisition’ tab, then new and give it a name (usually your name and something regarding the sample that you are looking at). Click on ‘Channels’ tab and +WF and add the channel that you wish to use (e.g. Reflected Light RL brightfield, which corresponds to mode of the microscope that you chose), click ‘add’ and close. The programme will remember the channel you chose under the name you gave, so If you use the microscope multiple times, just open the one with your name from this drop-down menu. Activate the Tiles tool by clicking the Tiles checkbox in the Acquisition tab. Then click ‘live’ (If the image appears black then check the light intensity on the microscope).
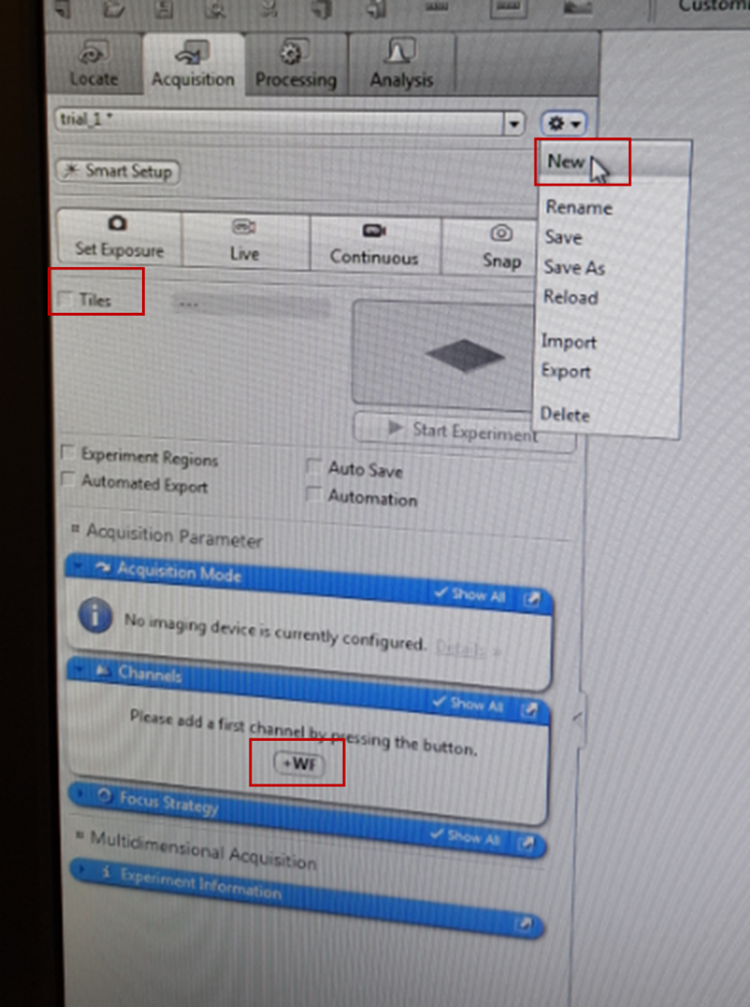
Make sure that the area you want to scan is within the range of the stage movement in X and Y direction. On the joystick there are various speed options available (F1 – F4), generally the slow speed is recommended for small samples and for higher magnifications, for smaller magnifications and bigger samples faster speed can be used.
The purpose of the Tiles tool is to acquire images that are made up of a number of individual images. To do Tiles experiment, we define the tile region and points with different Z-positions within the region, using suitable focus strategy. You can now set up Tiles experiment. In the ‘Tiles’ tab select ‘Stake’ (this option defines the tile region by specific marker points located at the corners of desired region. In the Tile Regions section u can define the tile region by other options too – ‘Tiles’ and ‘Size’, where the first determines the number of tiles you want in the X and Y input fields, e.g., X = 3, Y = 3 equals a tiles region containing 9 tiles, so that you can control how big will be one focus region. Alternatively, you can enter the size of the tile region that you want to add. these two options are for advanced users).
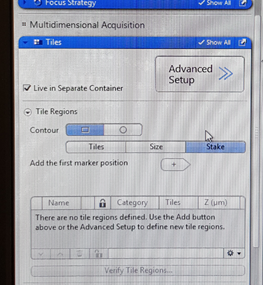
In the Contour, the square shaped scan option requires you to determine 4 corners of the region you want to acquire. Rotate your sample in the way that the edges of region you want to scan are along X and Y axes of the stage and move to the first corner of your region. Focus there and click  so you will add the first marker position. To add corners of the region, move the stage to another position on the sample and repeat the steps. The added region (TR1, TR2 - tile region 1 etc) is displayed in the tile regions list. You can see there a shape of the region, number of tiles and the size of your region, as well as the averaged Z position of the tile region.
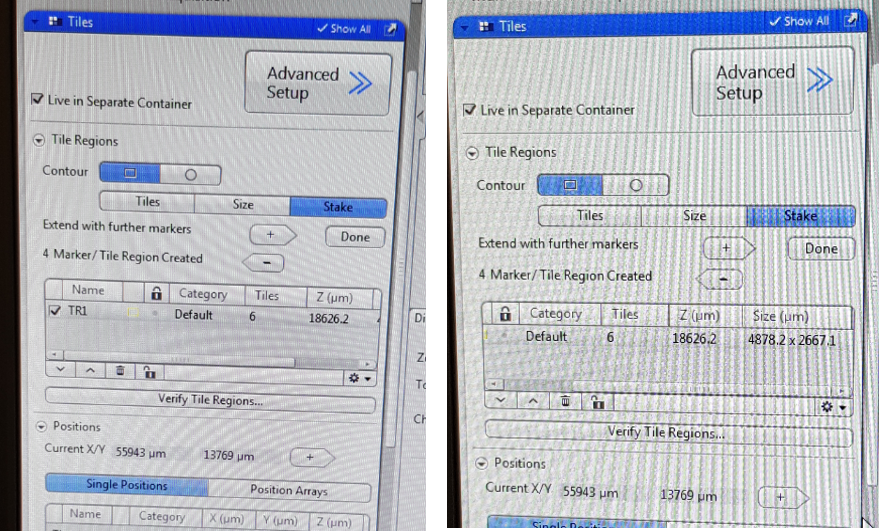
To ensure that the individual Z-positions of the tile regions are taken into account during acquisition, you need to use a focus strategy. If not, the software will use the current Z-position at the time the experiment is started for all the tile regions.
Advanced Setup makes it easier for you to create tile region with individual Z positions by displaying the distribution and dimensions of tile regions. You need to generate a Preview Scan (you can use an objective with a lower magnification so it will be quicker advanced users). Click on the ‘Tiles’, ‘Advanced Setup button’ and ‘start preview scan’. A series of snap images is acquired to generate a preview of the marked region - yellow colour. Before you start the preview scan, make sure that the intensity is adjusted correctly, otherwise the image will be black.
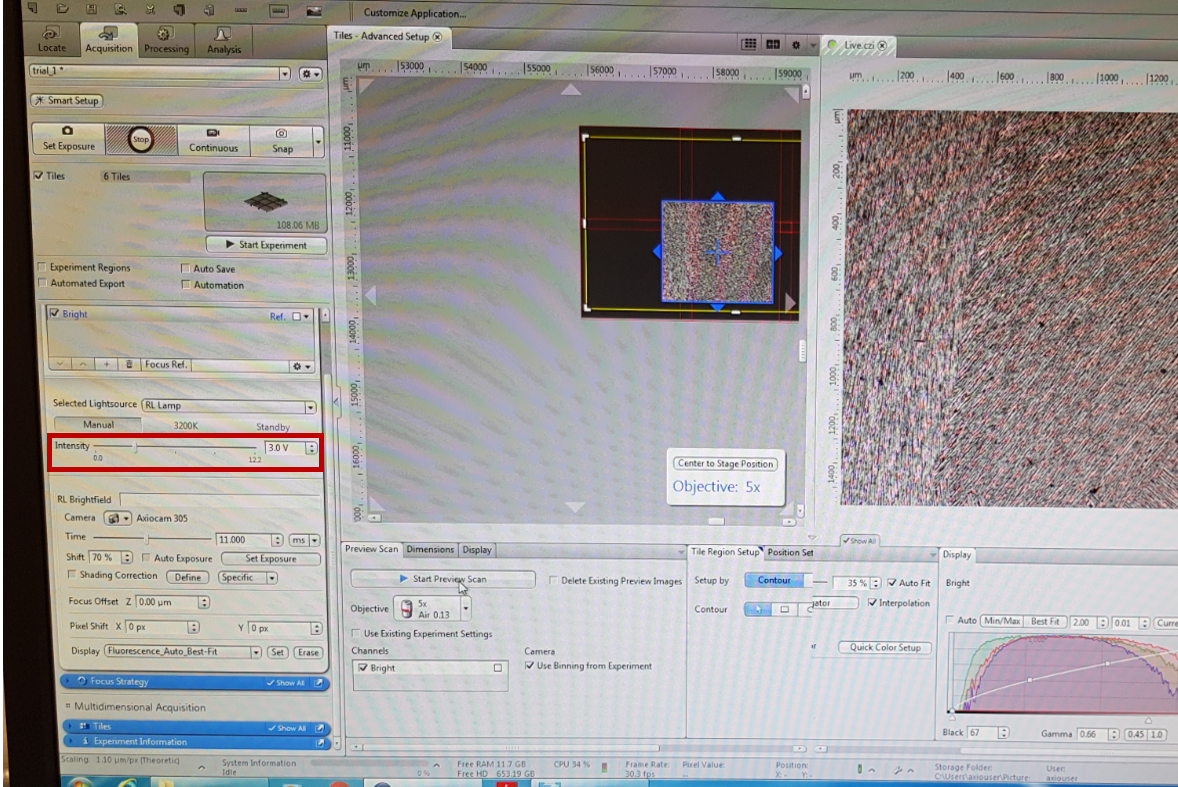
Once the preview scan is finished, you need to acquire the tile region with different Z-positions. From the list of tile Regions (TR1 etc) select the one that you are interested in. Select the ‘Support Points’ tab from the Tiles - Advanced Setup view options. Under Distribute Support Points on Selected Tile Regions, indicate the number of columns and rows for the distribution of the reference points and click distribute. These will be shown as yellow points in the stage view. You can adjust the distribution of the support points manually, as well as add individual support points by clicking on the Add Support Points at Current Stage and Focus Position button on the ‘Support Points’ tab.
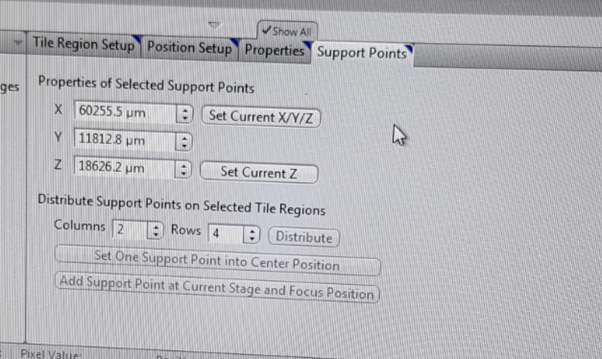
Distribute the support points across your tile region and adjust their number to the surface of your sample but also remember about the purpose of your map. A high reference-point density leads to more precise result, although the maximum useful density is one reference point per tile.
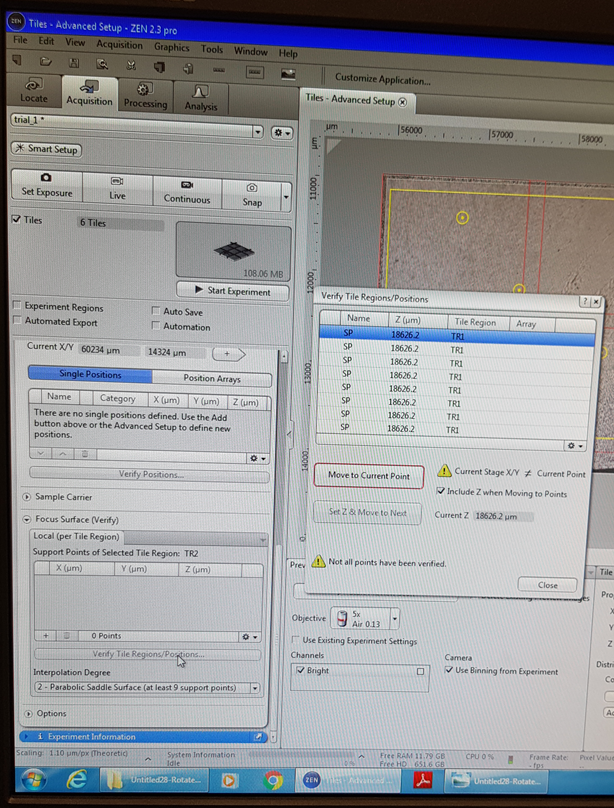
Now you will Verify Z-positions of support points. Click on the Verify Support Points button in the Focus Surface section of the Tiles tool. Click on the Move to Current Point button. Use the Live mode to set the Z-positions using the focus drive. Click Set Z & Move to Next on the first point and repeat for all your support points and close. Click ‘Start Experiment’ to begin the scan.
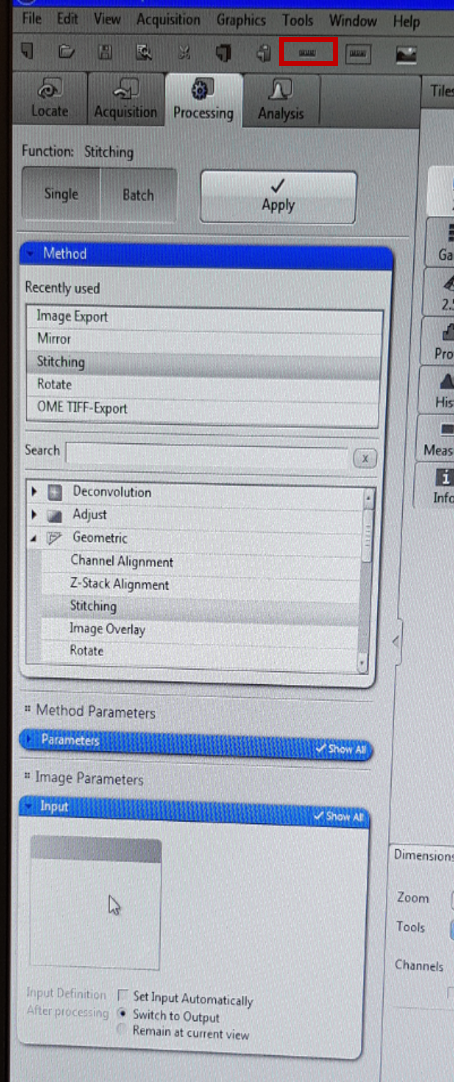
When the experiment is finished, you need to stitch individual images together, so the tiles are aligned and constitute a coherent map. The software uses a program to detect where pixels are misaligned in adjoining tiles and fuses them properly. Click ‘processing’ tab and then under the ‘Method’ click ‘stitching’. Under ‘input’ tab choose the experiment you want to stich and then Apply (at the top). Because of stitching, you might get an uneven edge of the map and you might want to crop them out. To do that, right click on the scan u want to crop, click create subset from R.O.I (region of interest) and crop the image out. Then right click on the image again and click create subset from R.O.I. Before you save the image, you can adjust some settings on histogram which is placed below the scan to your liking and add the scale bar by clicking ‘scale bar’ from the top menu (marked on red in above image). You can also change the properties of the scale bar itself by right click on it and clicking Format Graphical Elements.
If you don’t want to change anything more on the image you can now save it. You can save the experiment in CZI format which will allow you to open it again in ZEN pro. In order to do that, click file and save as CZI to your external storage. You can also save Jpeg image by clicking ‘image export’ under the ‘Method’ tab. Under ‘Parameters’ tab select the destination folder of the export and change image format to Jpeg. Choose the input image and click Apply at the top. Check If your Jpeg image appears in your destination folder. Remember to save all your images to your own USB stick as the data from the University computer is regularly cleaned. Jpeg format compresses the image so the resultant map is not of full resolution. In principle you should save the map in TIFF format as it keeps the original resolution and therefore is appropriate for image analyses, however often there is a problem when trying to save TIFF on this computer (this needs to be resolved).
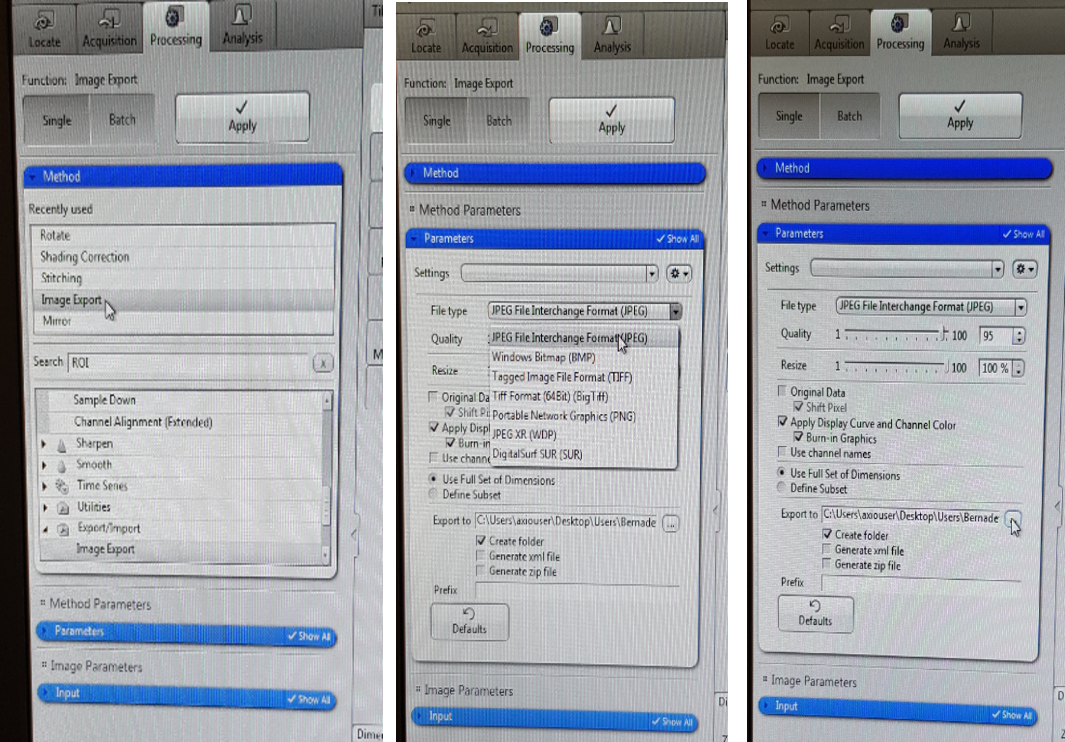
If the software comes up with the memory issue during saving (this happens usually with big samples or the areas scanned with big magnification, both resulting in big size of the map), click File, ‘save as with options’ and change the type of the file to tiff and then save. However, this means that you have a lower quality image as the software applies different compression in this case.
Once you are done, lower down the stage with the sample on it (to the maximum), go back to the lowest magnification and take your sample off from the stage. Close the software, turn the microscope off, power supply off and log off the PC.
